Understanding PostgreSQL New Relic On-Host Integration
K
I like learning new stuff - anything, including technology. I love tinkering with new tools, systems and services, especially open source projects
Search for a command to run...
I like learning new stuff - anything, including technology. I love tinkering with new tools, systems and services, especially open source projects
No comments yet. Be the first to comment.
inodes is a concept in Linux. Oh wait…no Fun fact that I learned while experimenting on my macOS - I can see that the term and concept of inodes exists in the context of macOS too Looks like it’s a “Unix” thing and Linux and Darwin, both are Unix bas...

You can look for Kubernetes Preemption Events in your observability system assuming you are exporting your Kubernetes Events to some store like some time series DB or similar In our case, we use Prometheus and we have an exporter for exporting the Ku...

Recently, when I discovered the py-spy profiler took for Python, I also discovered Speedscope, which is visualization tool for visualizing performance data (performance profile etc). This is a flamegraph Visualization. I have something of this sort w...

So, today, we had an issue in one of our internal systems called API Tester. It was very slow. Only today it was slow, and the CPU usage was very high according to our monitoring systems, especially since today morning. Before noticing the CPU usage,...

If you have Prometheus running and scraping metrics - You can find Kubernetes list of features enabled information for every feature using kubernetes_feature_enabled metric which gives build information kubernetes_feature_enabled{} The name of the f...

This is a continuation of my previous post Understanding data ingested in New Relic
In my previous post, I spoke about how our New Relic Bill was high and how I narrowed it down to what was causing the issue. I hadn't narrowed down enough though. The following is what we did in the previous post -
High Bill 💵 💸 -> Why? -> Lot of Data Ingested -> Why? Which Component? -> Infrastructure integrations -> Why? Which Component/Infrastructure Integration? -> PostgreSQL On-Host Integration
After narrowing down to PostgreSQL On-Host Integration being the issue, I hadn't dived more deeper to understand the problem. That's what we will be doing in this post today and look at what remedies we have at our disposal to manage high data ingestion causing high bills
First, remember that - just because high data is being ingested and is causing the bill to be high, one cannot simply stop sending data. We send data to New Relic so that it can help us monitor our applications and systems. So, one has to look at all the data that one sends to New Relic or any such monitoring platform, and look at the data and try to classify them as important/necessary vs unnecessary. And then throw the unnecessary stuff, and see if that can reduce the data ingestion and hence the cost
Let's look at the PostgreSQL On-Host Integration Data -
I started looking at the New Relic documentation for PostgreSQL integration to understand what data is being captured
I noticed that there are different events we capture to which different metrics are attached -
PostgreSQLDatabaseSample
PostgreSQLIndexSample
PostgreSQLInstanceSample
PostgreSQLTableSample
PgBouncerSample
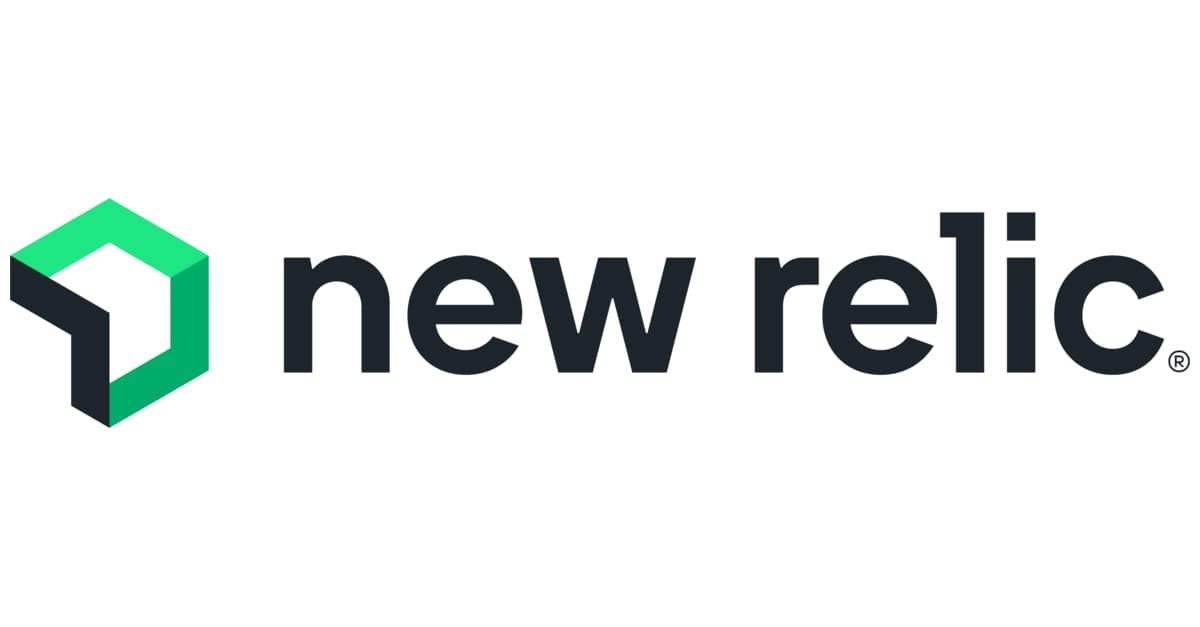
I was trying to look at which of these events take up a lot of data. I went back to the On-Host Integration Data Analysis dashboard to find the data which showed us that PostgreSQL On-Host Integration (OHI) is taking up a lot of data.
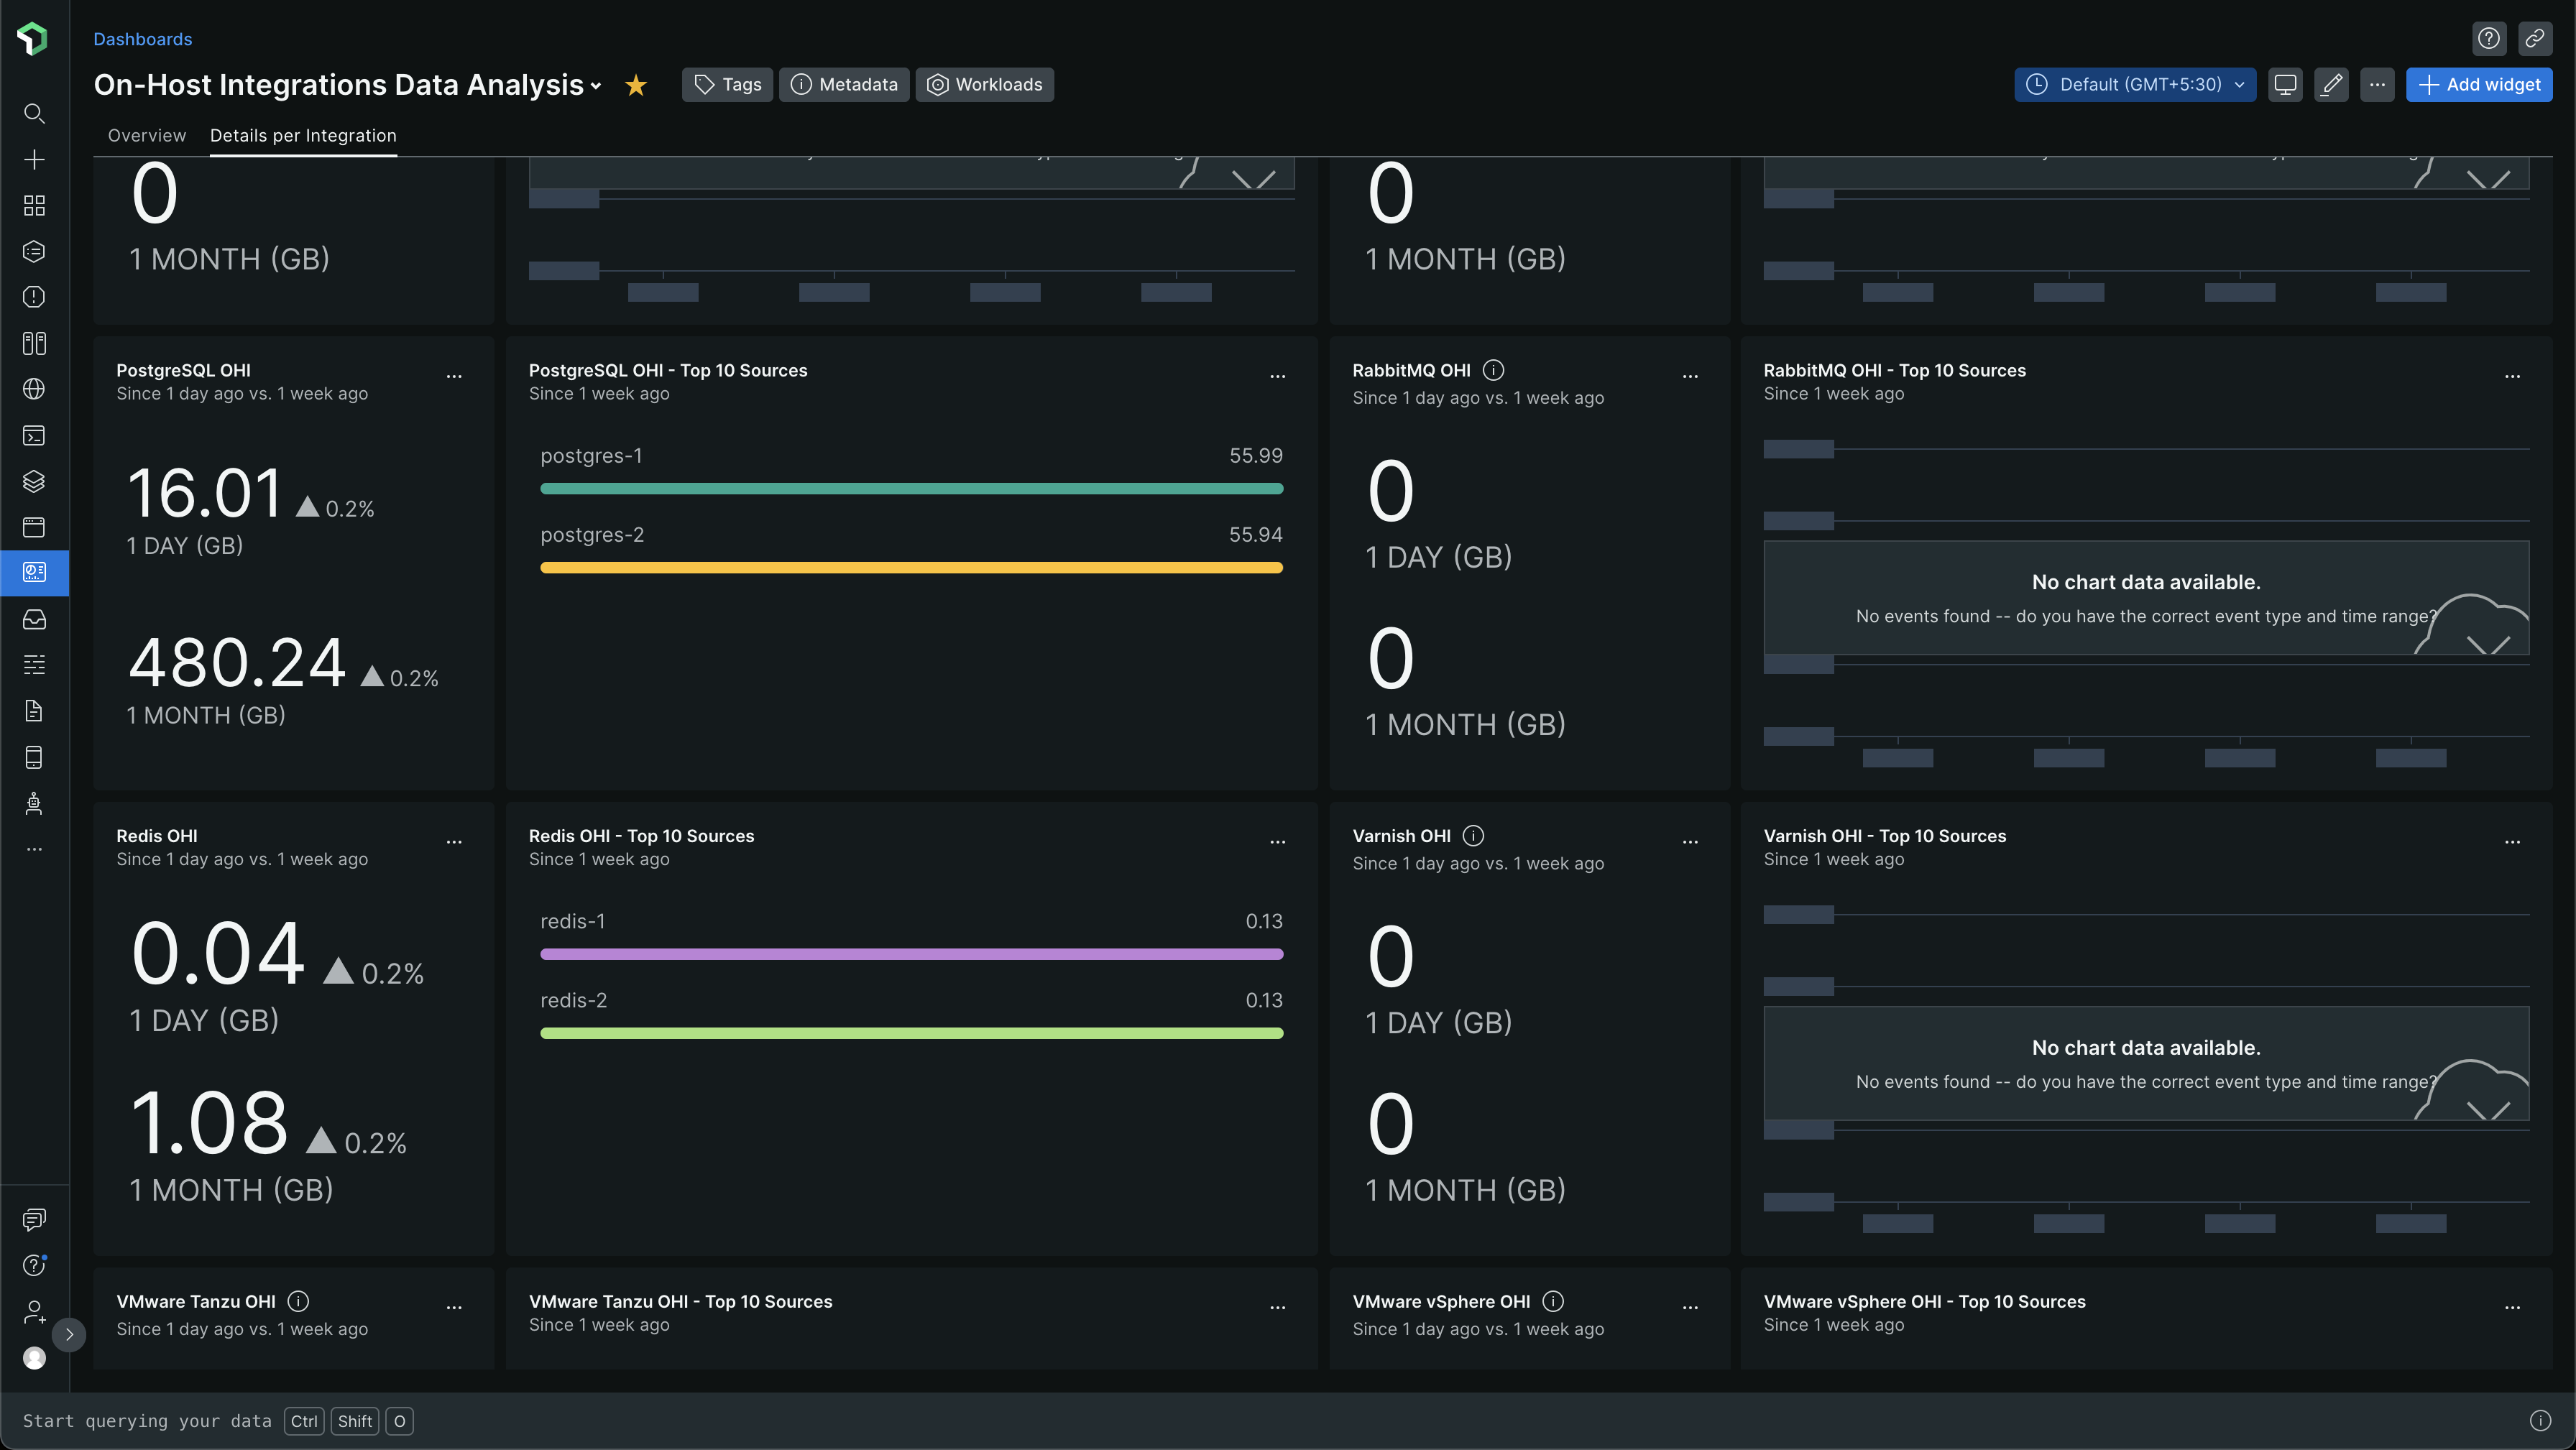
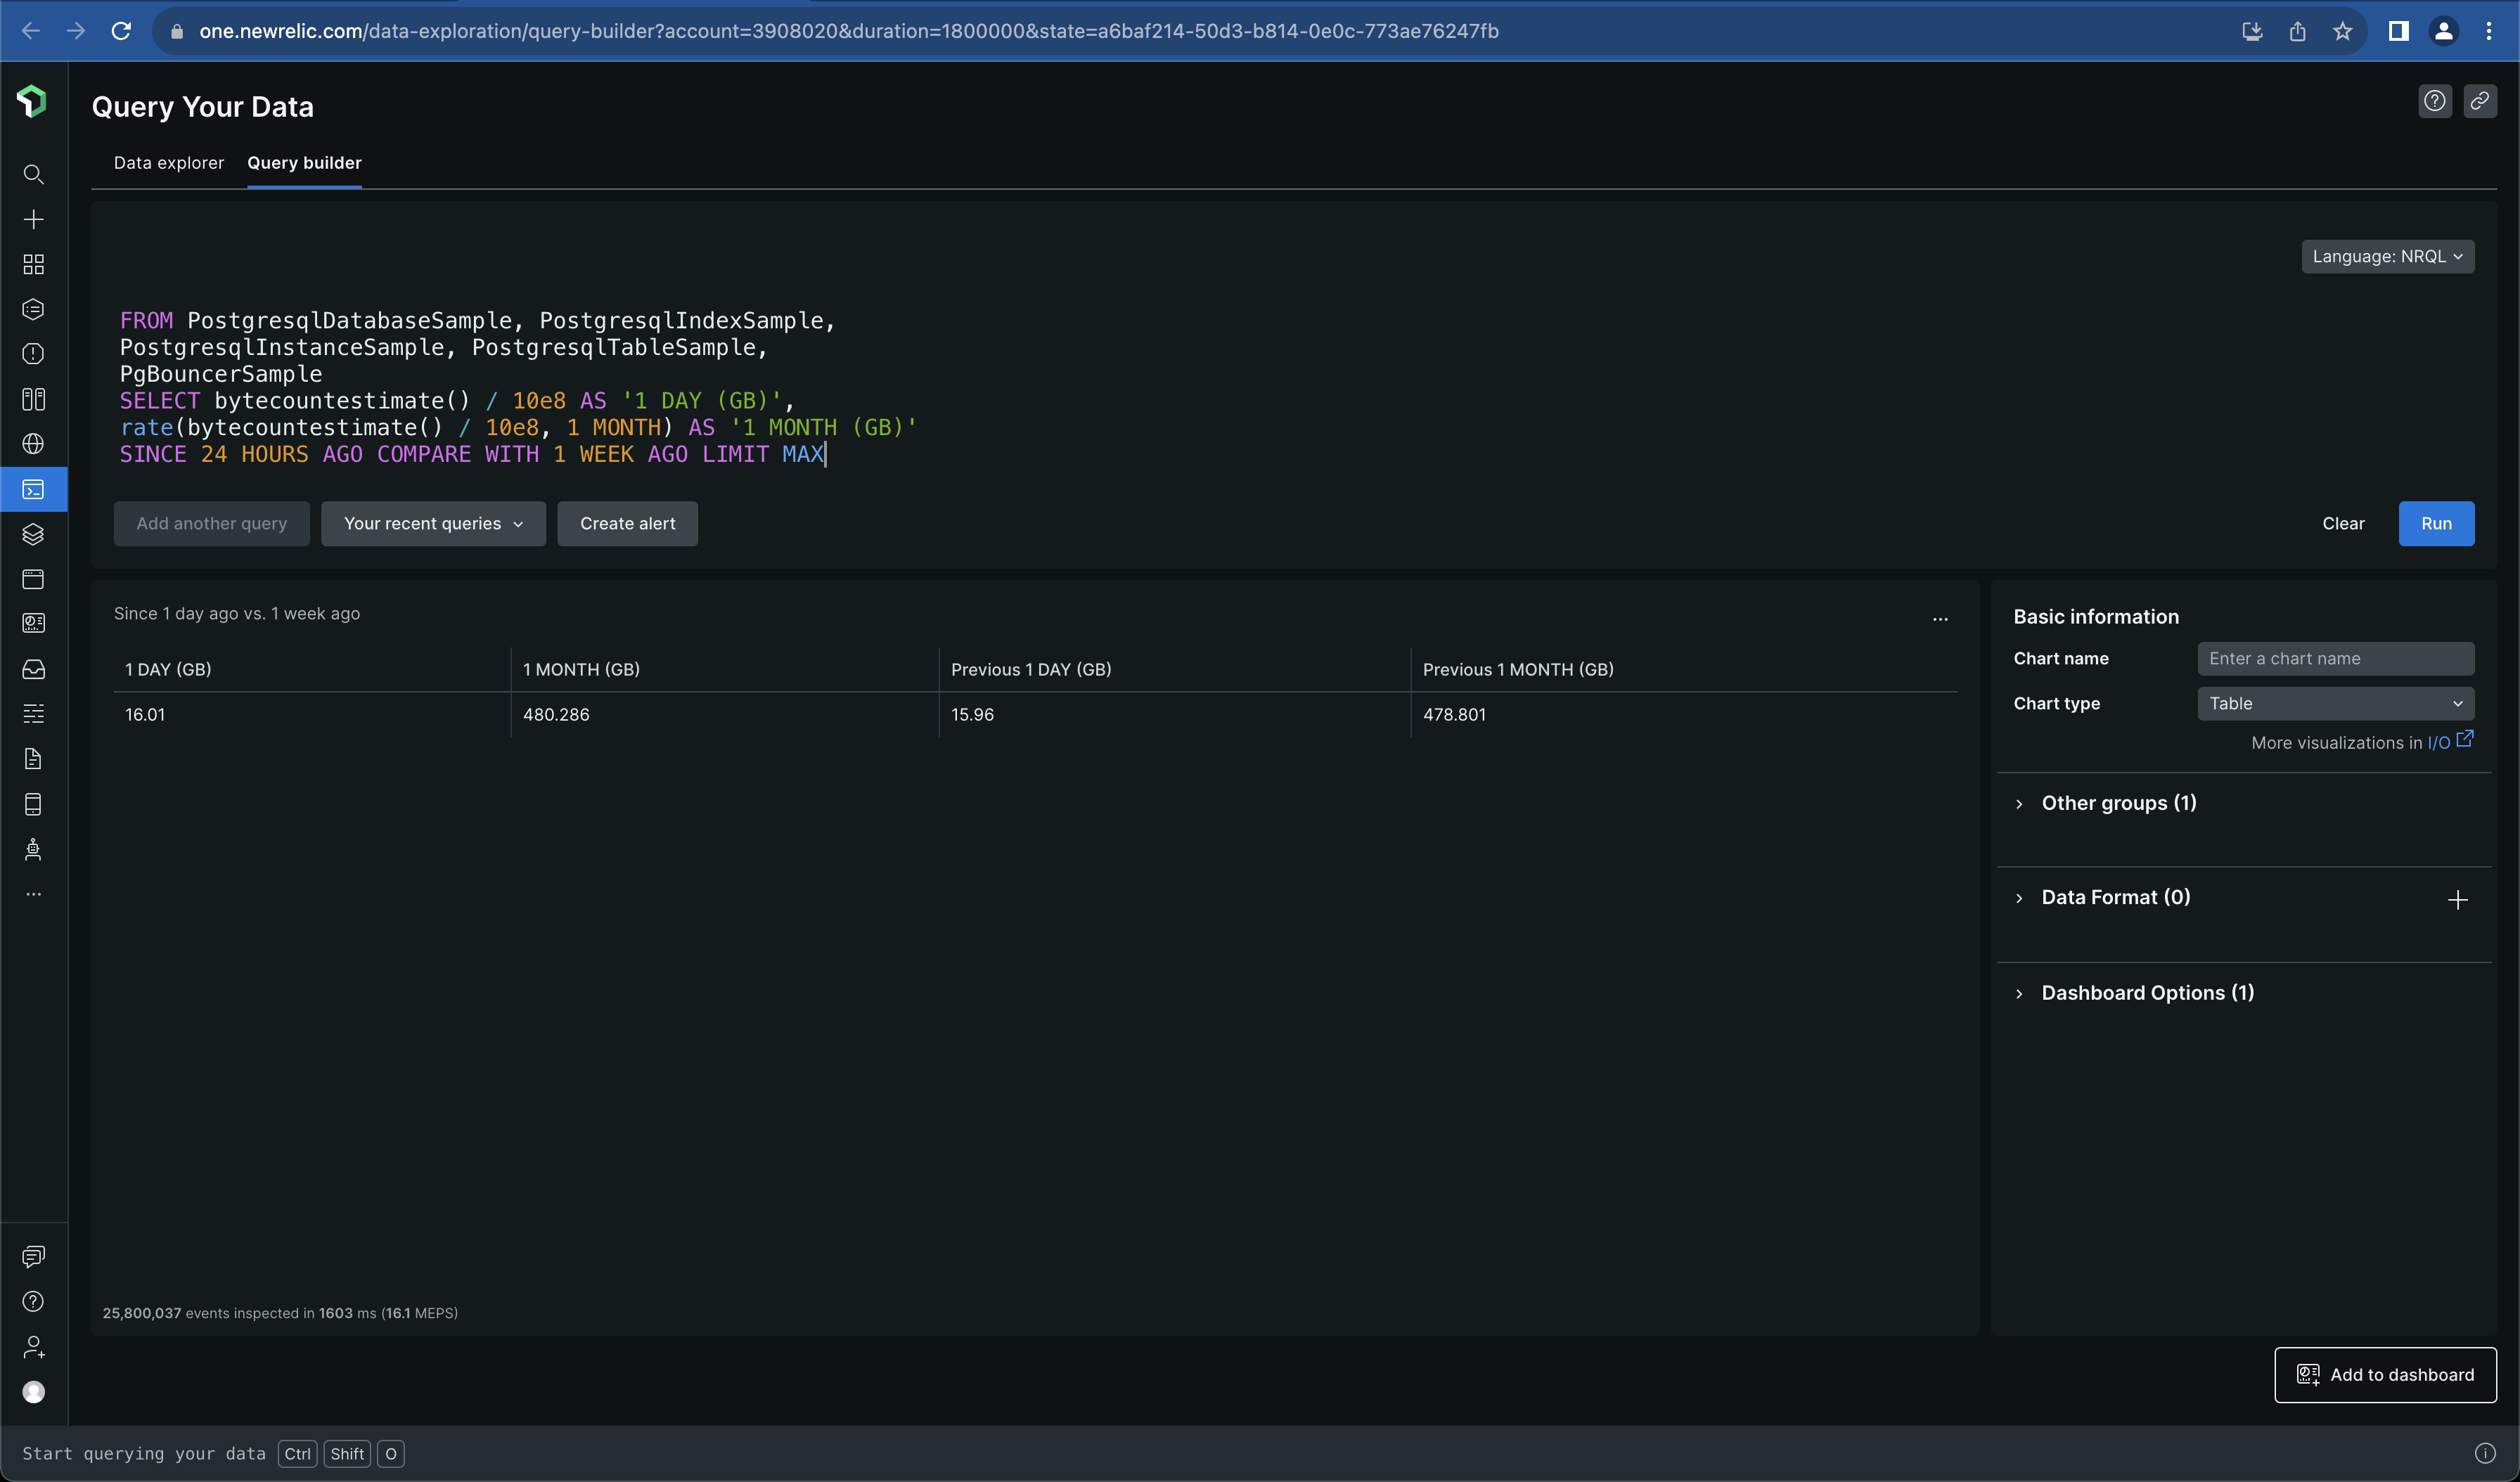
I started looking at the New Relic Query Language (NRQL) queries for these charts. I simply clicked the three dots ... and chose View query
and I got the query
The query I got was
FROM PostgresqlDatabaseSample, PostgresqlIndexSample,
PostgresqlInstanceSample, PostgresqlTableSample,
PgBouncerSample
SELECT bytecountestimate() / 10e8 AS '1 DAY (GB)',
rate(bytecountestimate() / 10e8, 1 MONTH) AS '1 MONTH (GB)'
SINCE 24 HOURS AGO COMPARE WITH 1 WEEK AGO LIMIT MAX
Let's put this query more beautifully -
FROM PostgresqlDatabaseSample, PostgresqlIndexSample,
PostgresqlInstanceSample, PostgresqlTableSample,
PgBouncerSample
SELECT bytecountestimate() / 10e8 AS '1 DAY (GB)',
rate(bytecountestimate() / 10e8, 1 MONTH) AS '1 MONTH (GB)'
SINCE 24 HOURS AGO COMPARE WITH 1 WEEK AGO LIMIT MAX
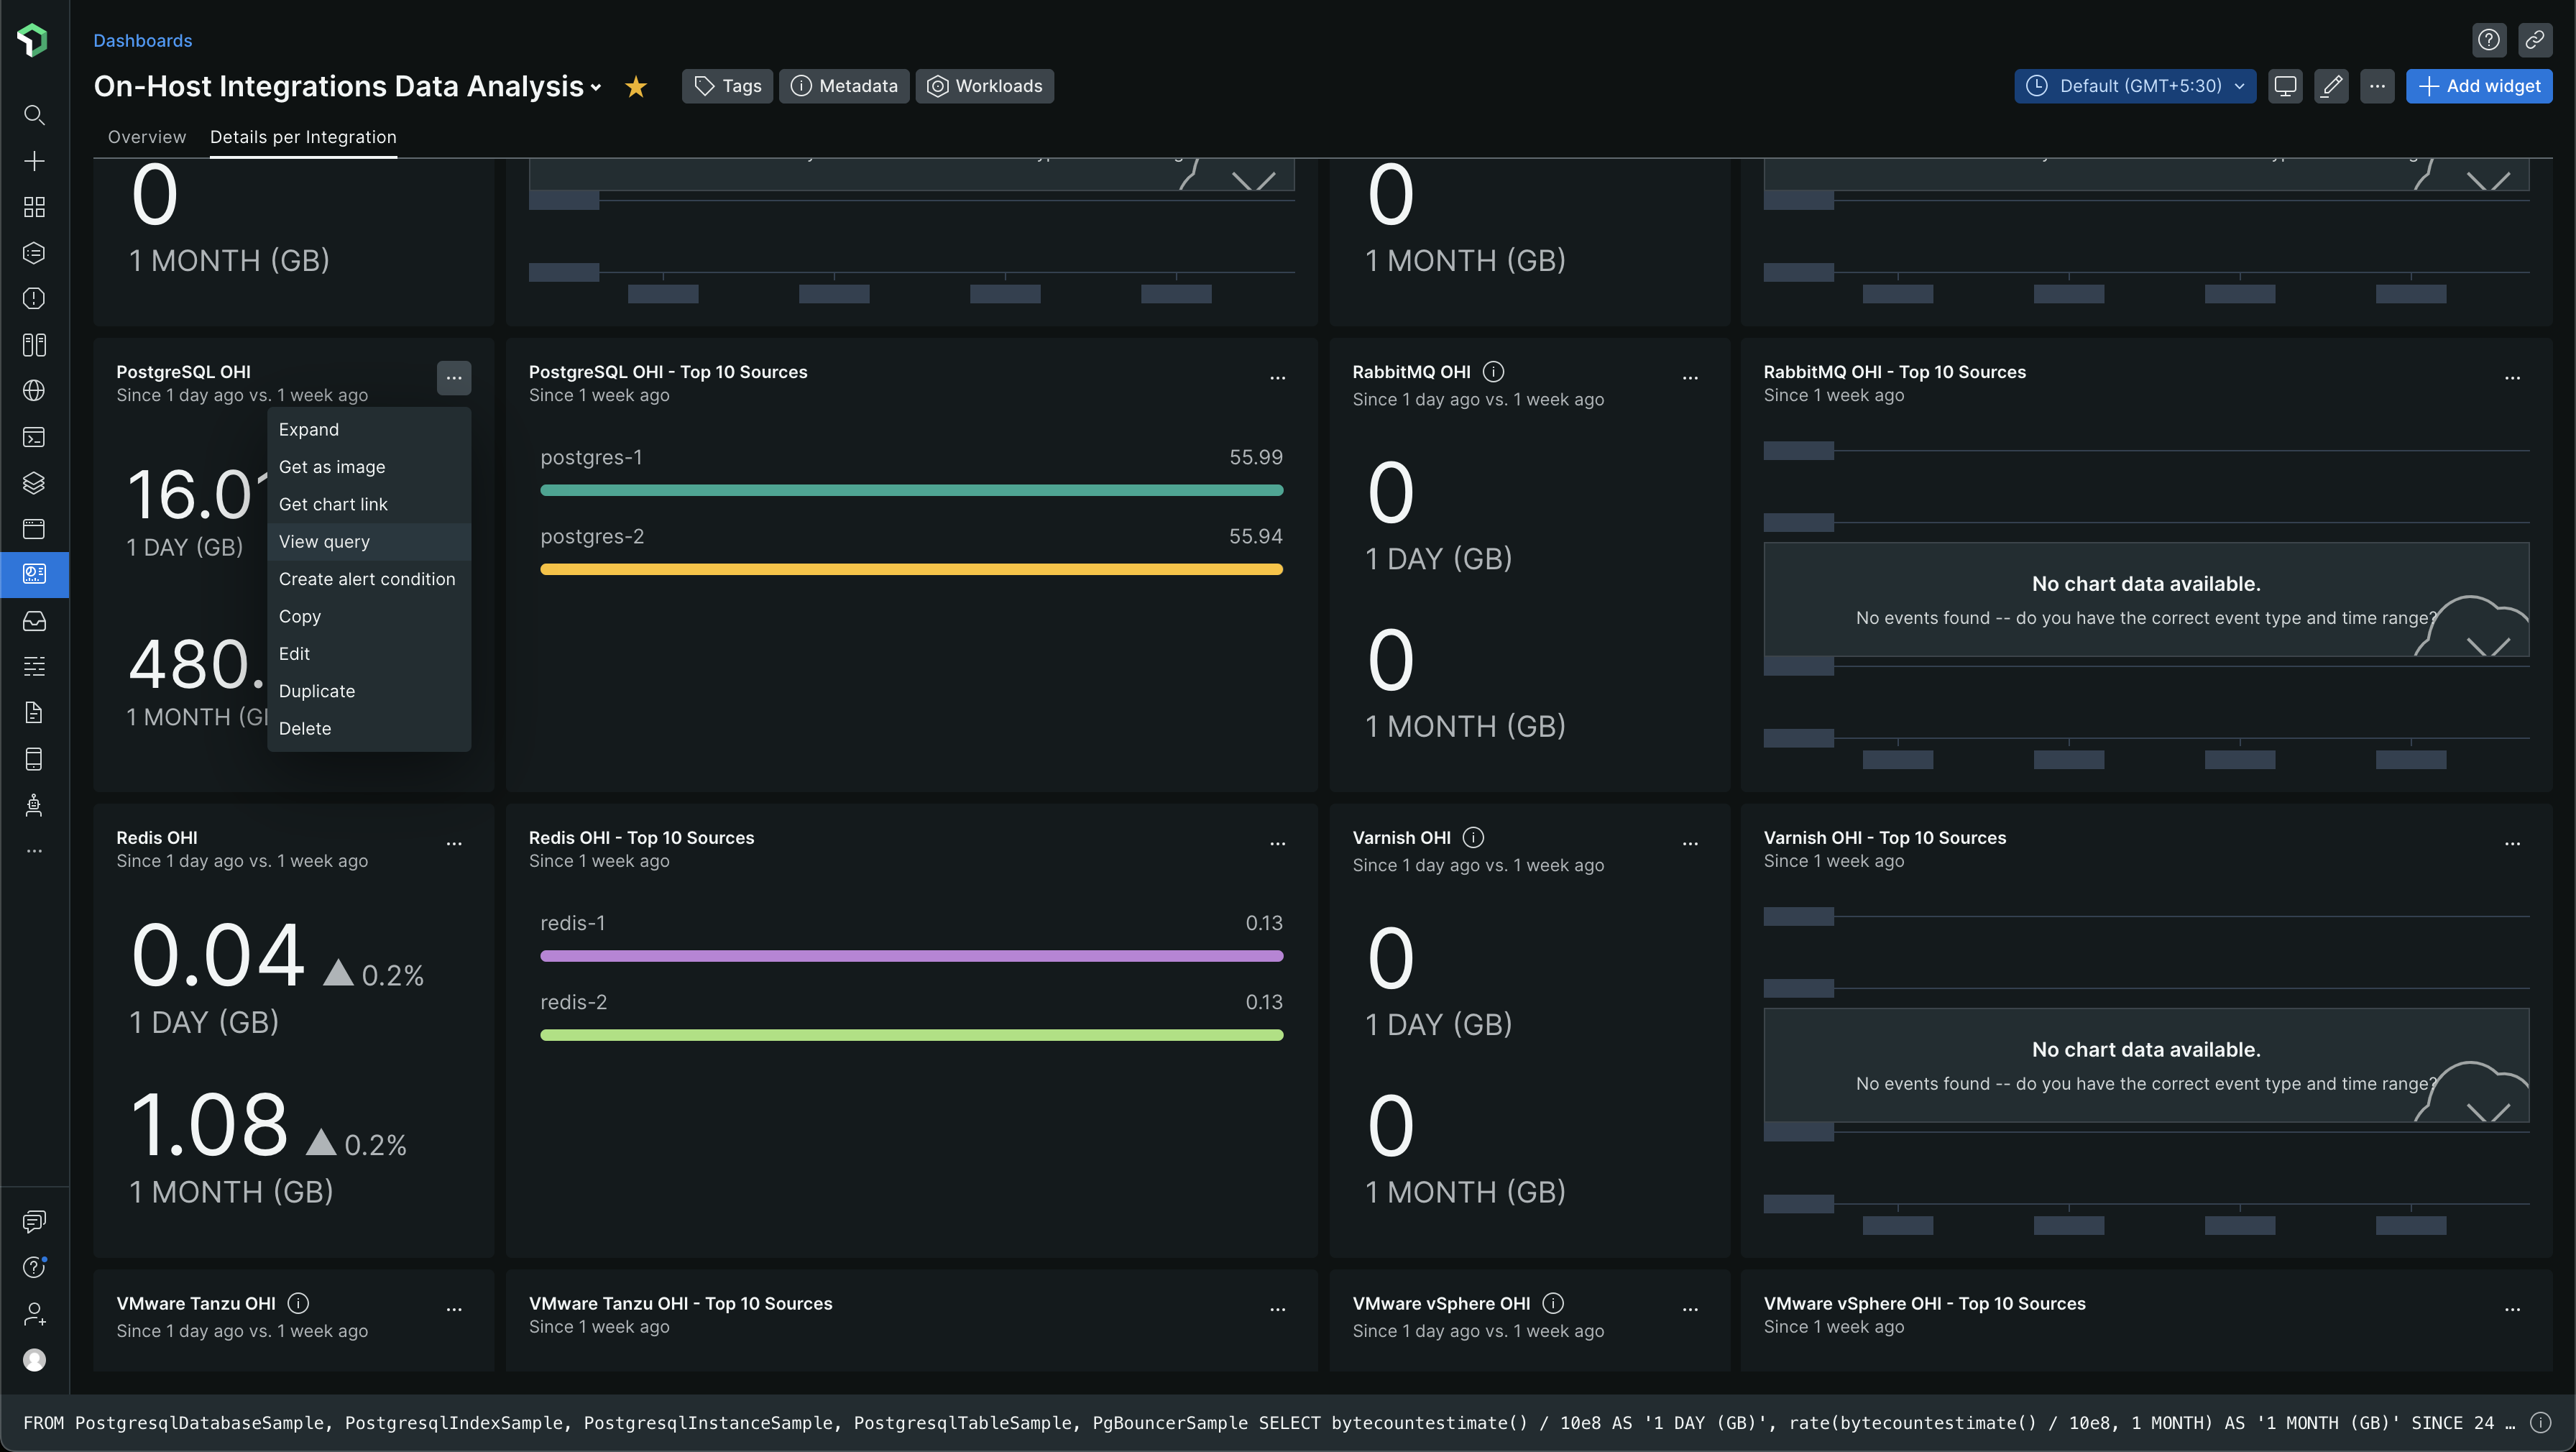
From the NRQL query, we can see that it considers all the event types that PostgreSQL OHI sends to New Relic. Below is how the query looks like in the query builder, with its output for Togai data
Let's also look at the top sources for the PostgreSQL OHI (On-Host Integration). Let's get the NRQL query for it
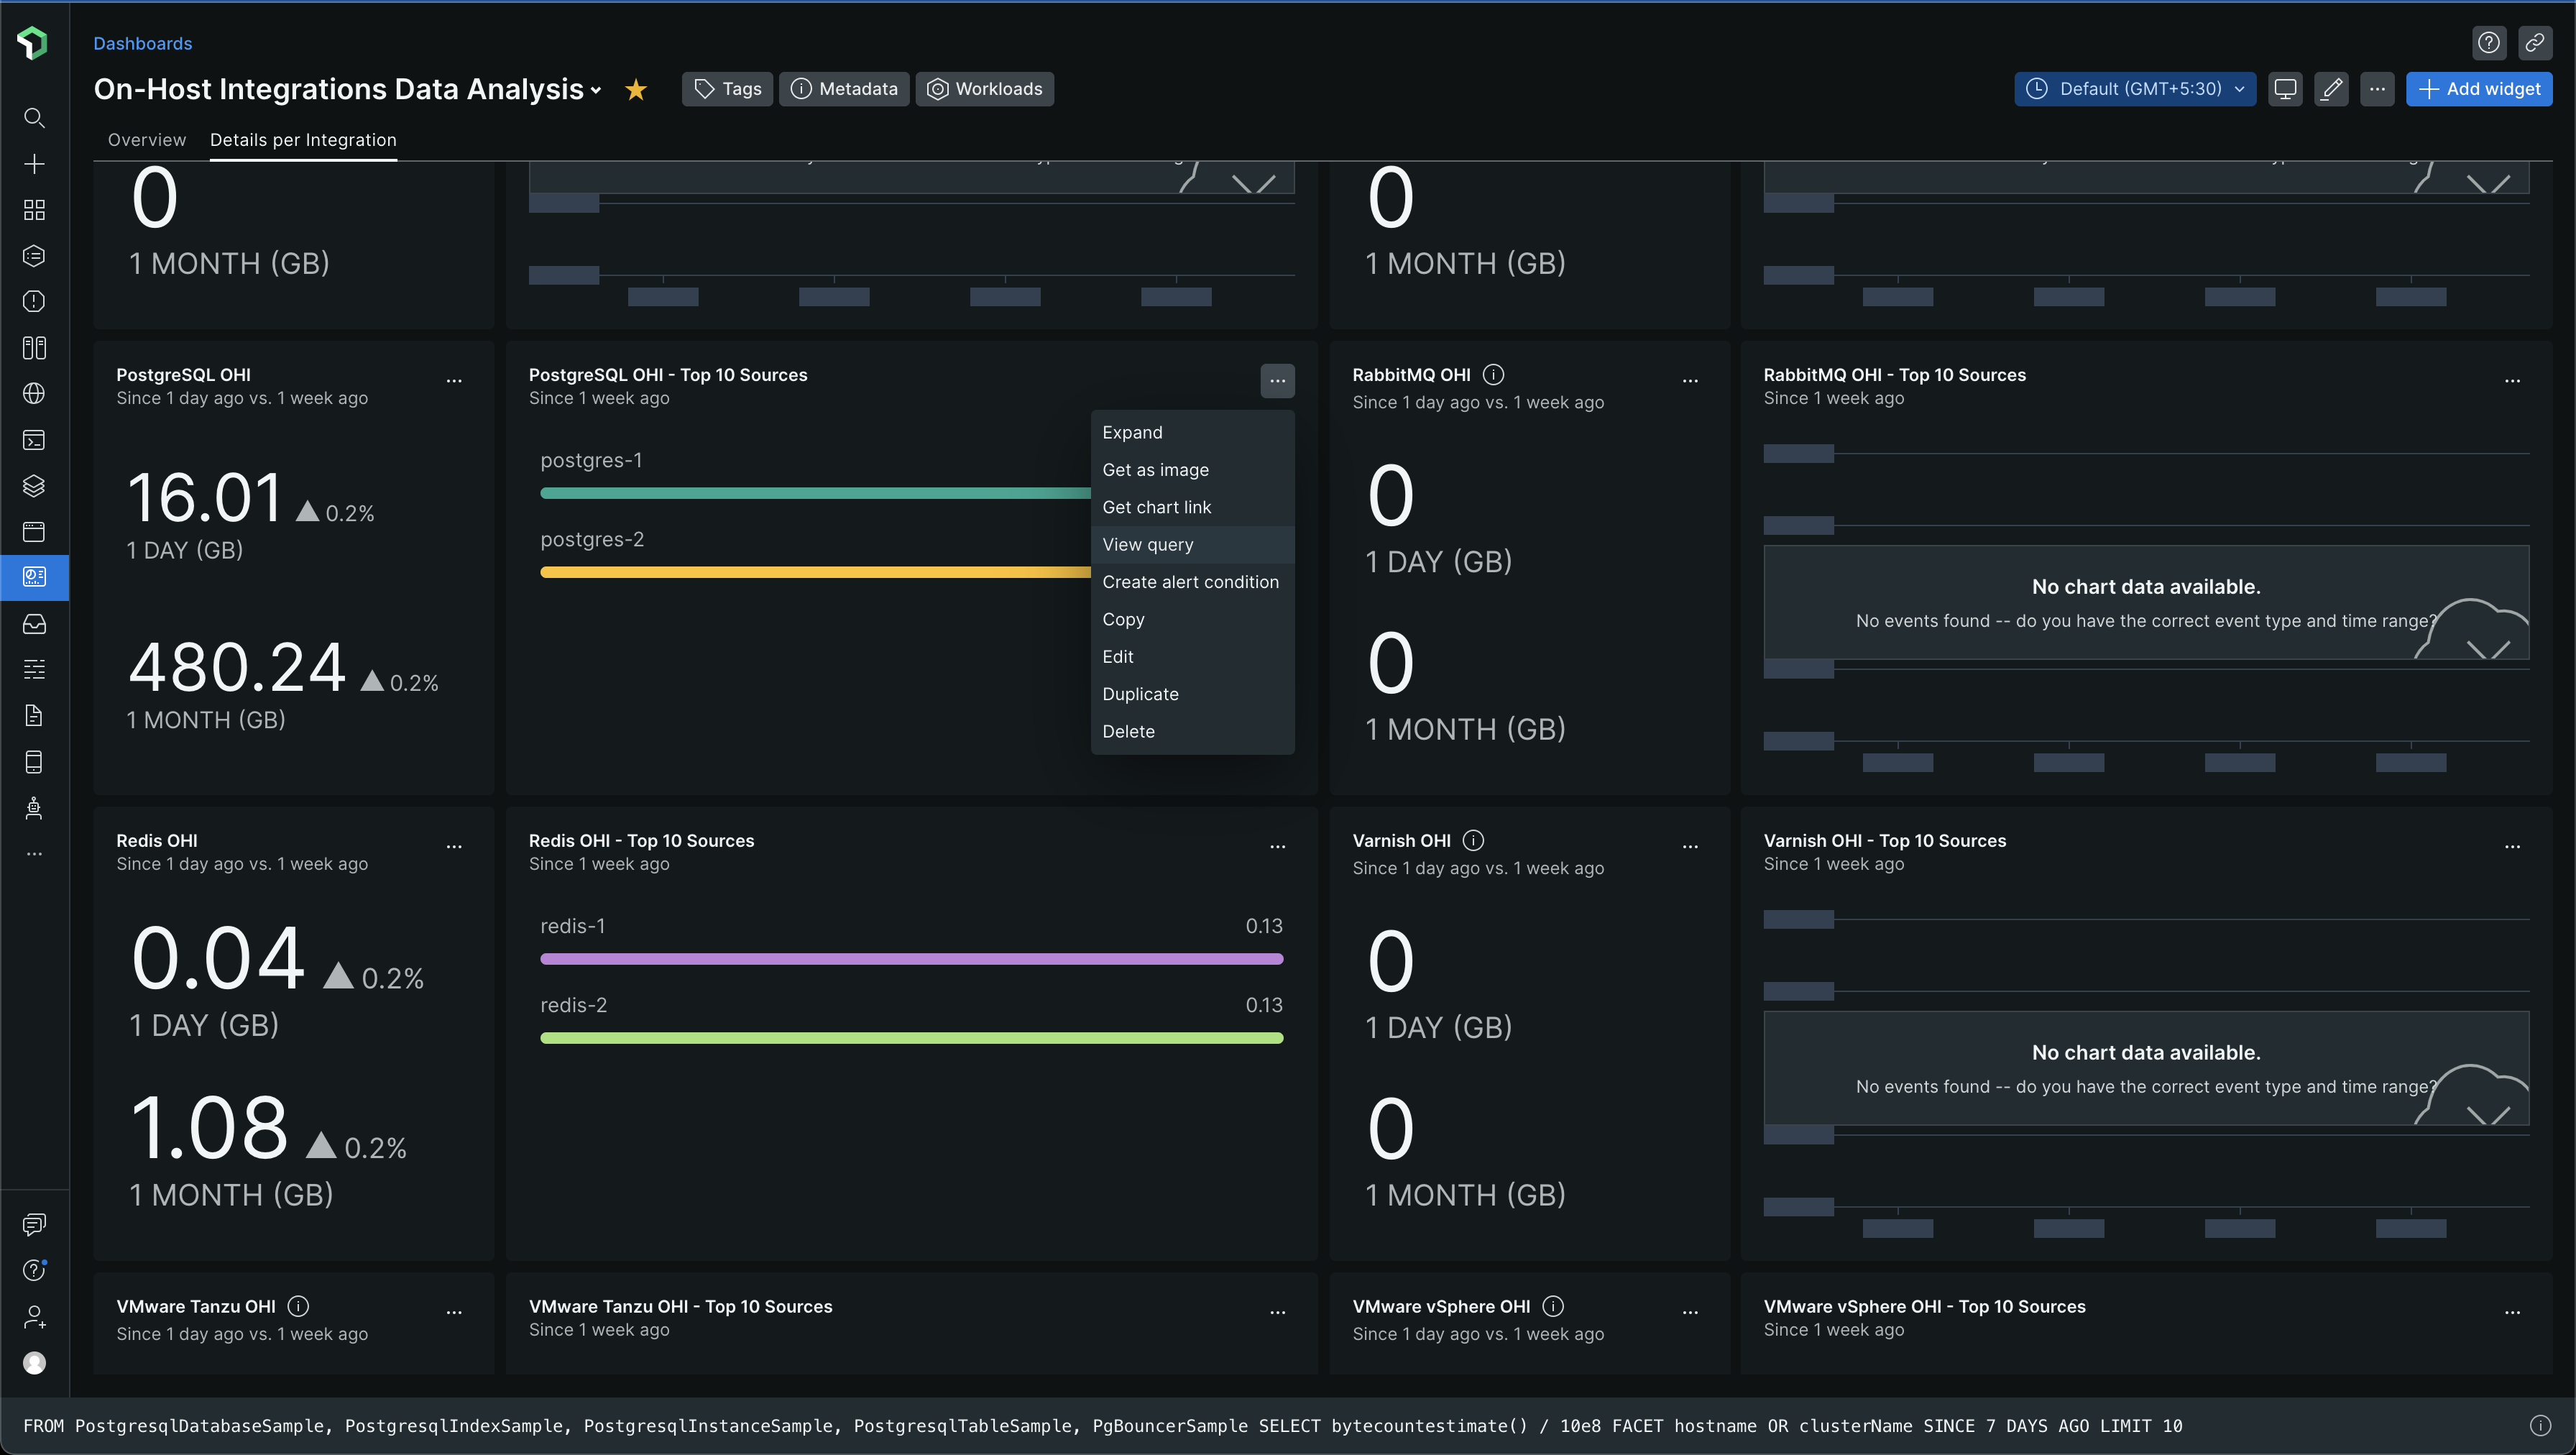
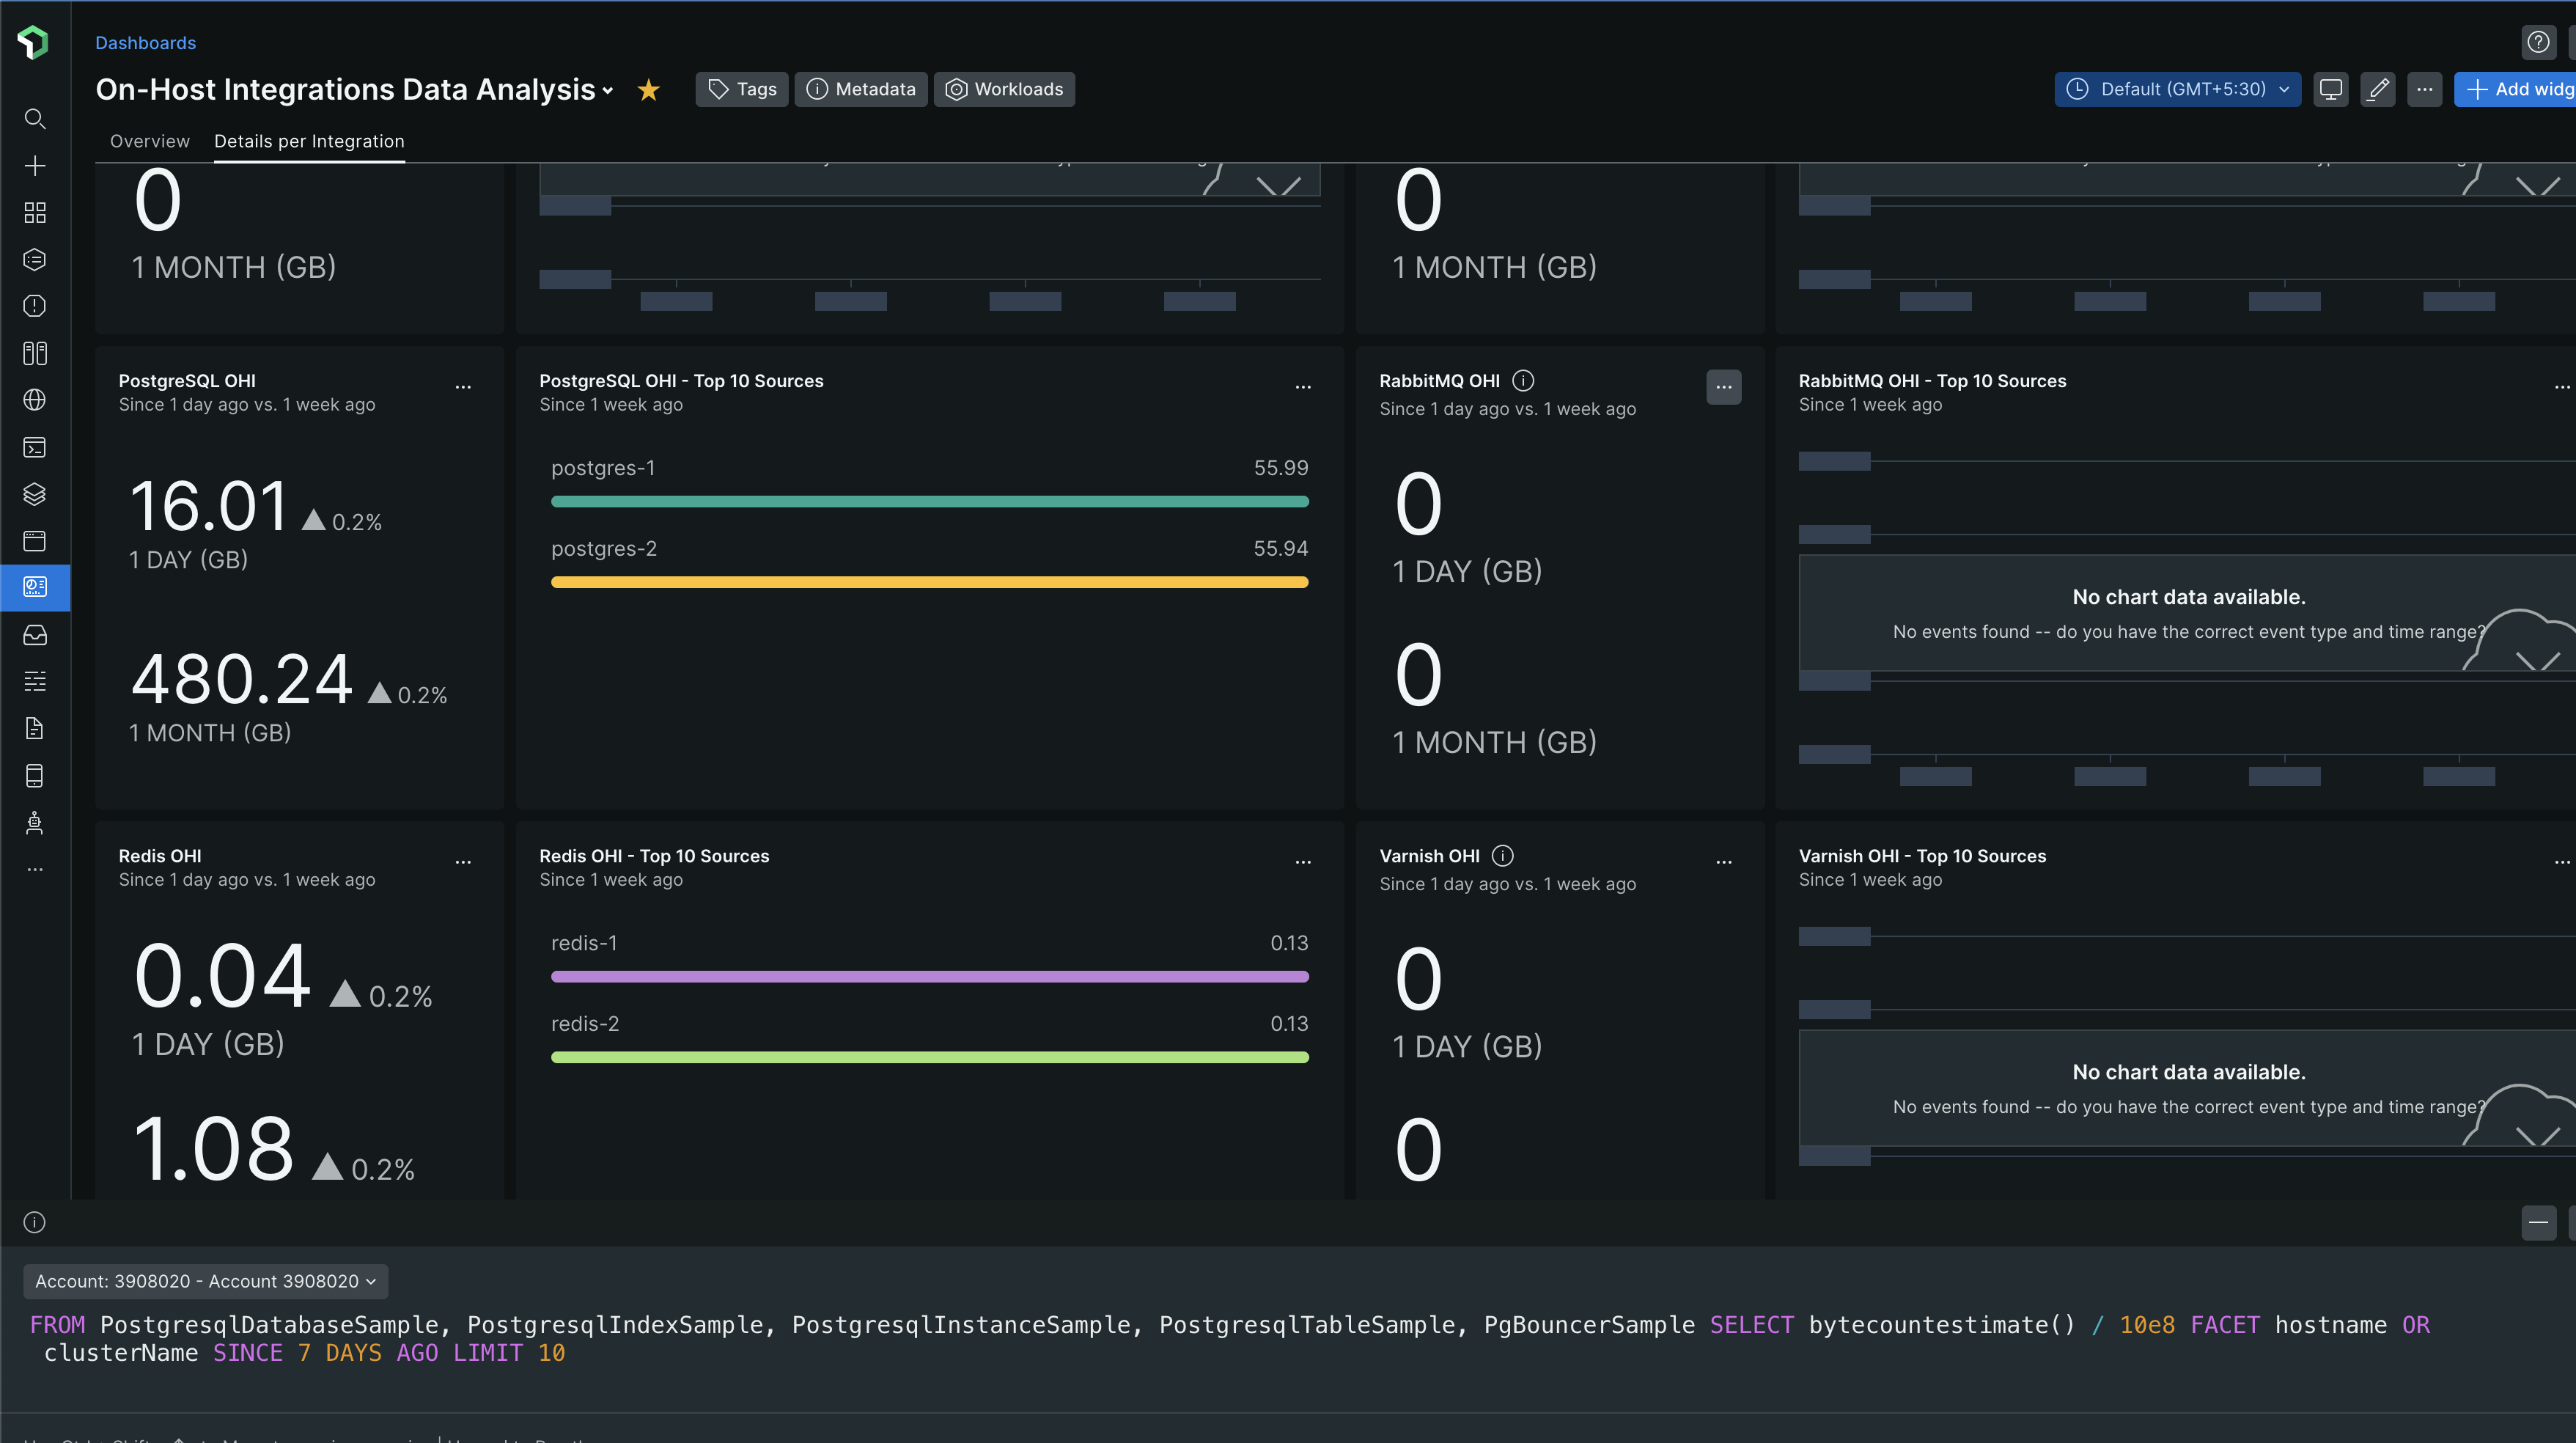
And the NRQL query for it looks like this -
FROM PostgresqlDatabaseSample, PostgresqlIndexSample,
PostgresqlInstanceSample, PostgresqlTableSample,
PgBouncerSample
SELECT bytecountestimate() / 10e8
FACET hostname OR clusterName
SINCE 7 DAYS AGO LIMIT 10
Let's beautify it
FROM PostgresqlDatabaseSample, PostgresqlIndexSample,
PostgresqlInstanceSample, PostgresqlTableSample,
PgBouncerSample
SELECT bytecountestimate() / 10e8
FACET hostname OR clusterName
SINCE 7 DAYS AGO LIMIT 10
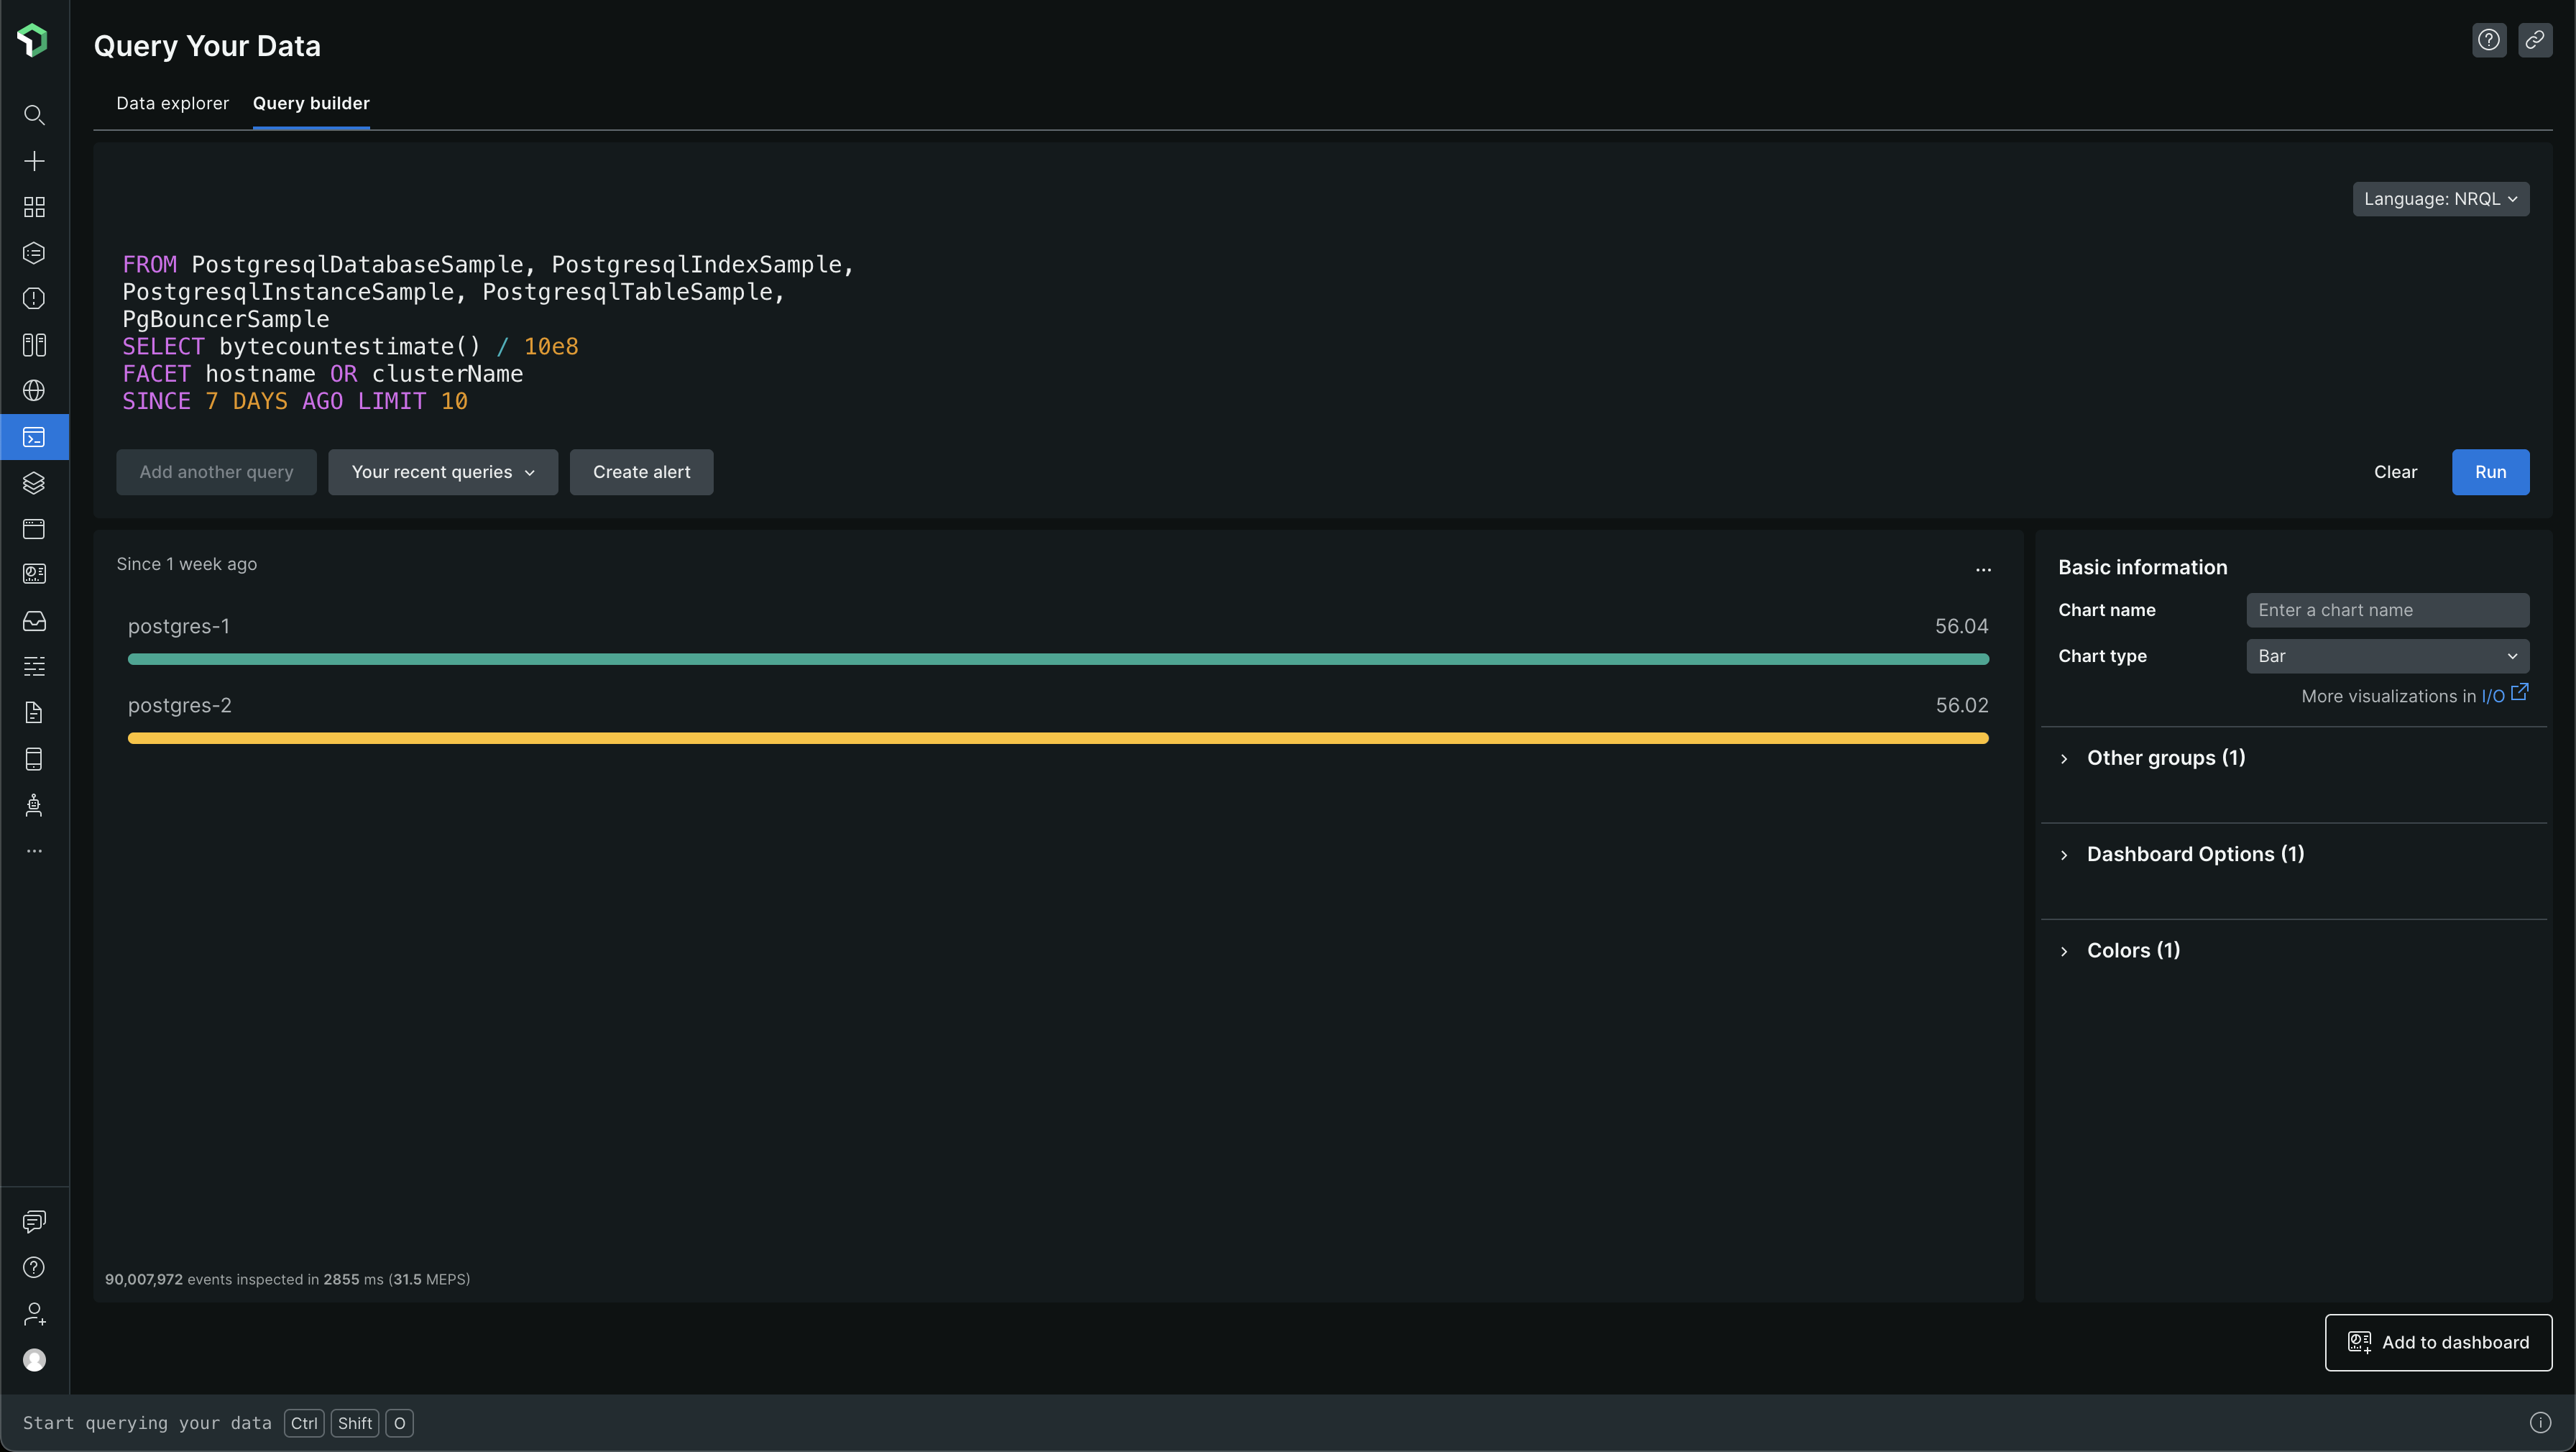
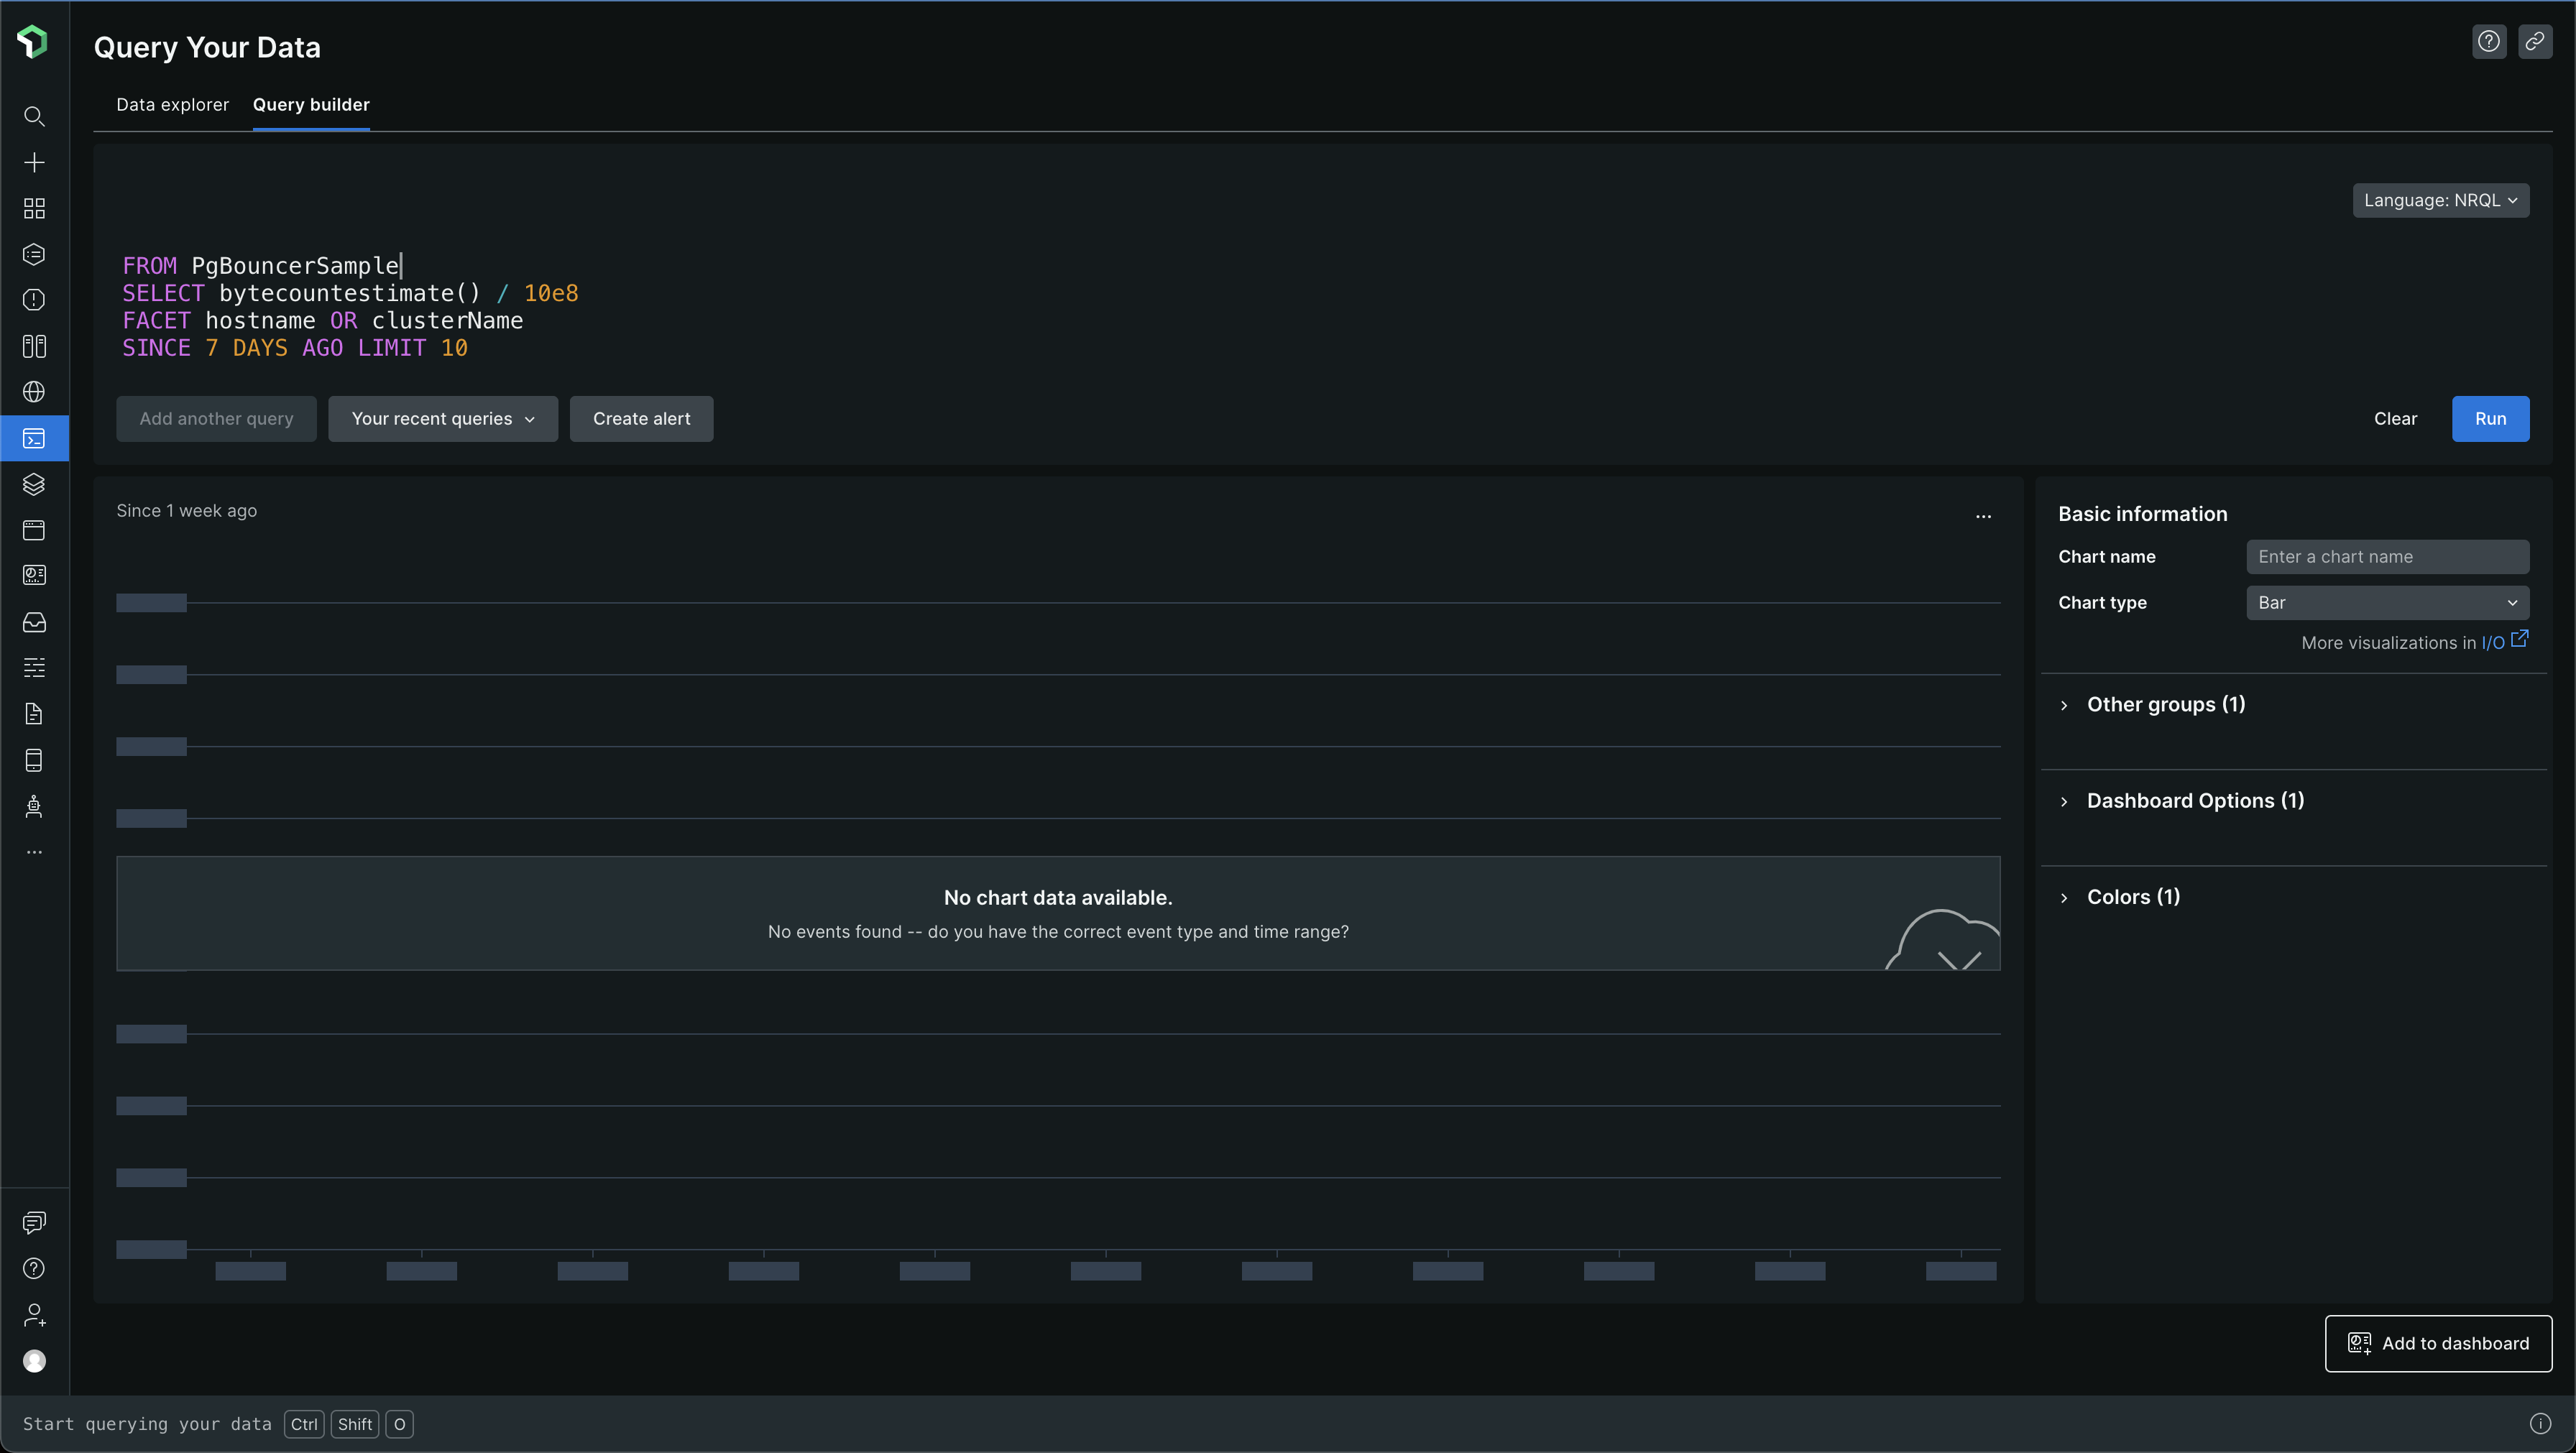
It looks like the below in the Query Builder section under Query Your Data. The data unit here is GB (Gigabyte)
Now, we know that a few sets of PostgreSQL events are being collected and they make up for a large portion of the data ingested into the New Relic Platform for Togai
From the data, we can see that on average 56GB gets ingested per PostgreSQL server instance for a week (7 days). We have 2 instances in Sandbox and 2 instances in Production. One instance is the primary and the other one is a secondary / replica. Our staging has only one instance, the primary instance.
From the data, we can see that on average 8GB of data gets ingested per PostgreSQL instance for a day. That's 240 GB of data (30 days x 8GB) that gets ingested per PostgreSQL instance for a month. For 2 PostgreSQL instances, that's 480GB per month!
With New Relic's $0.30/GB of data ingestion cost, PostgreSQL data ingestion alone will cost us $144 per month! 😮😯 That's quite some money
Let's look at which PostgreSQL events are too big
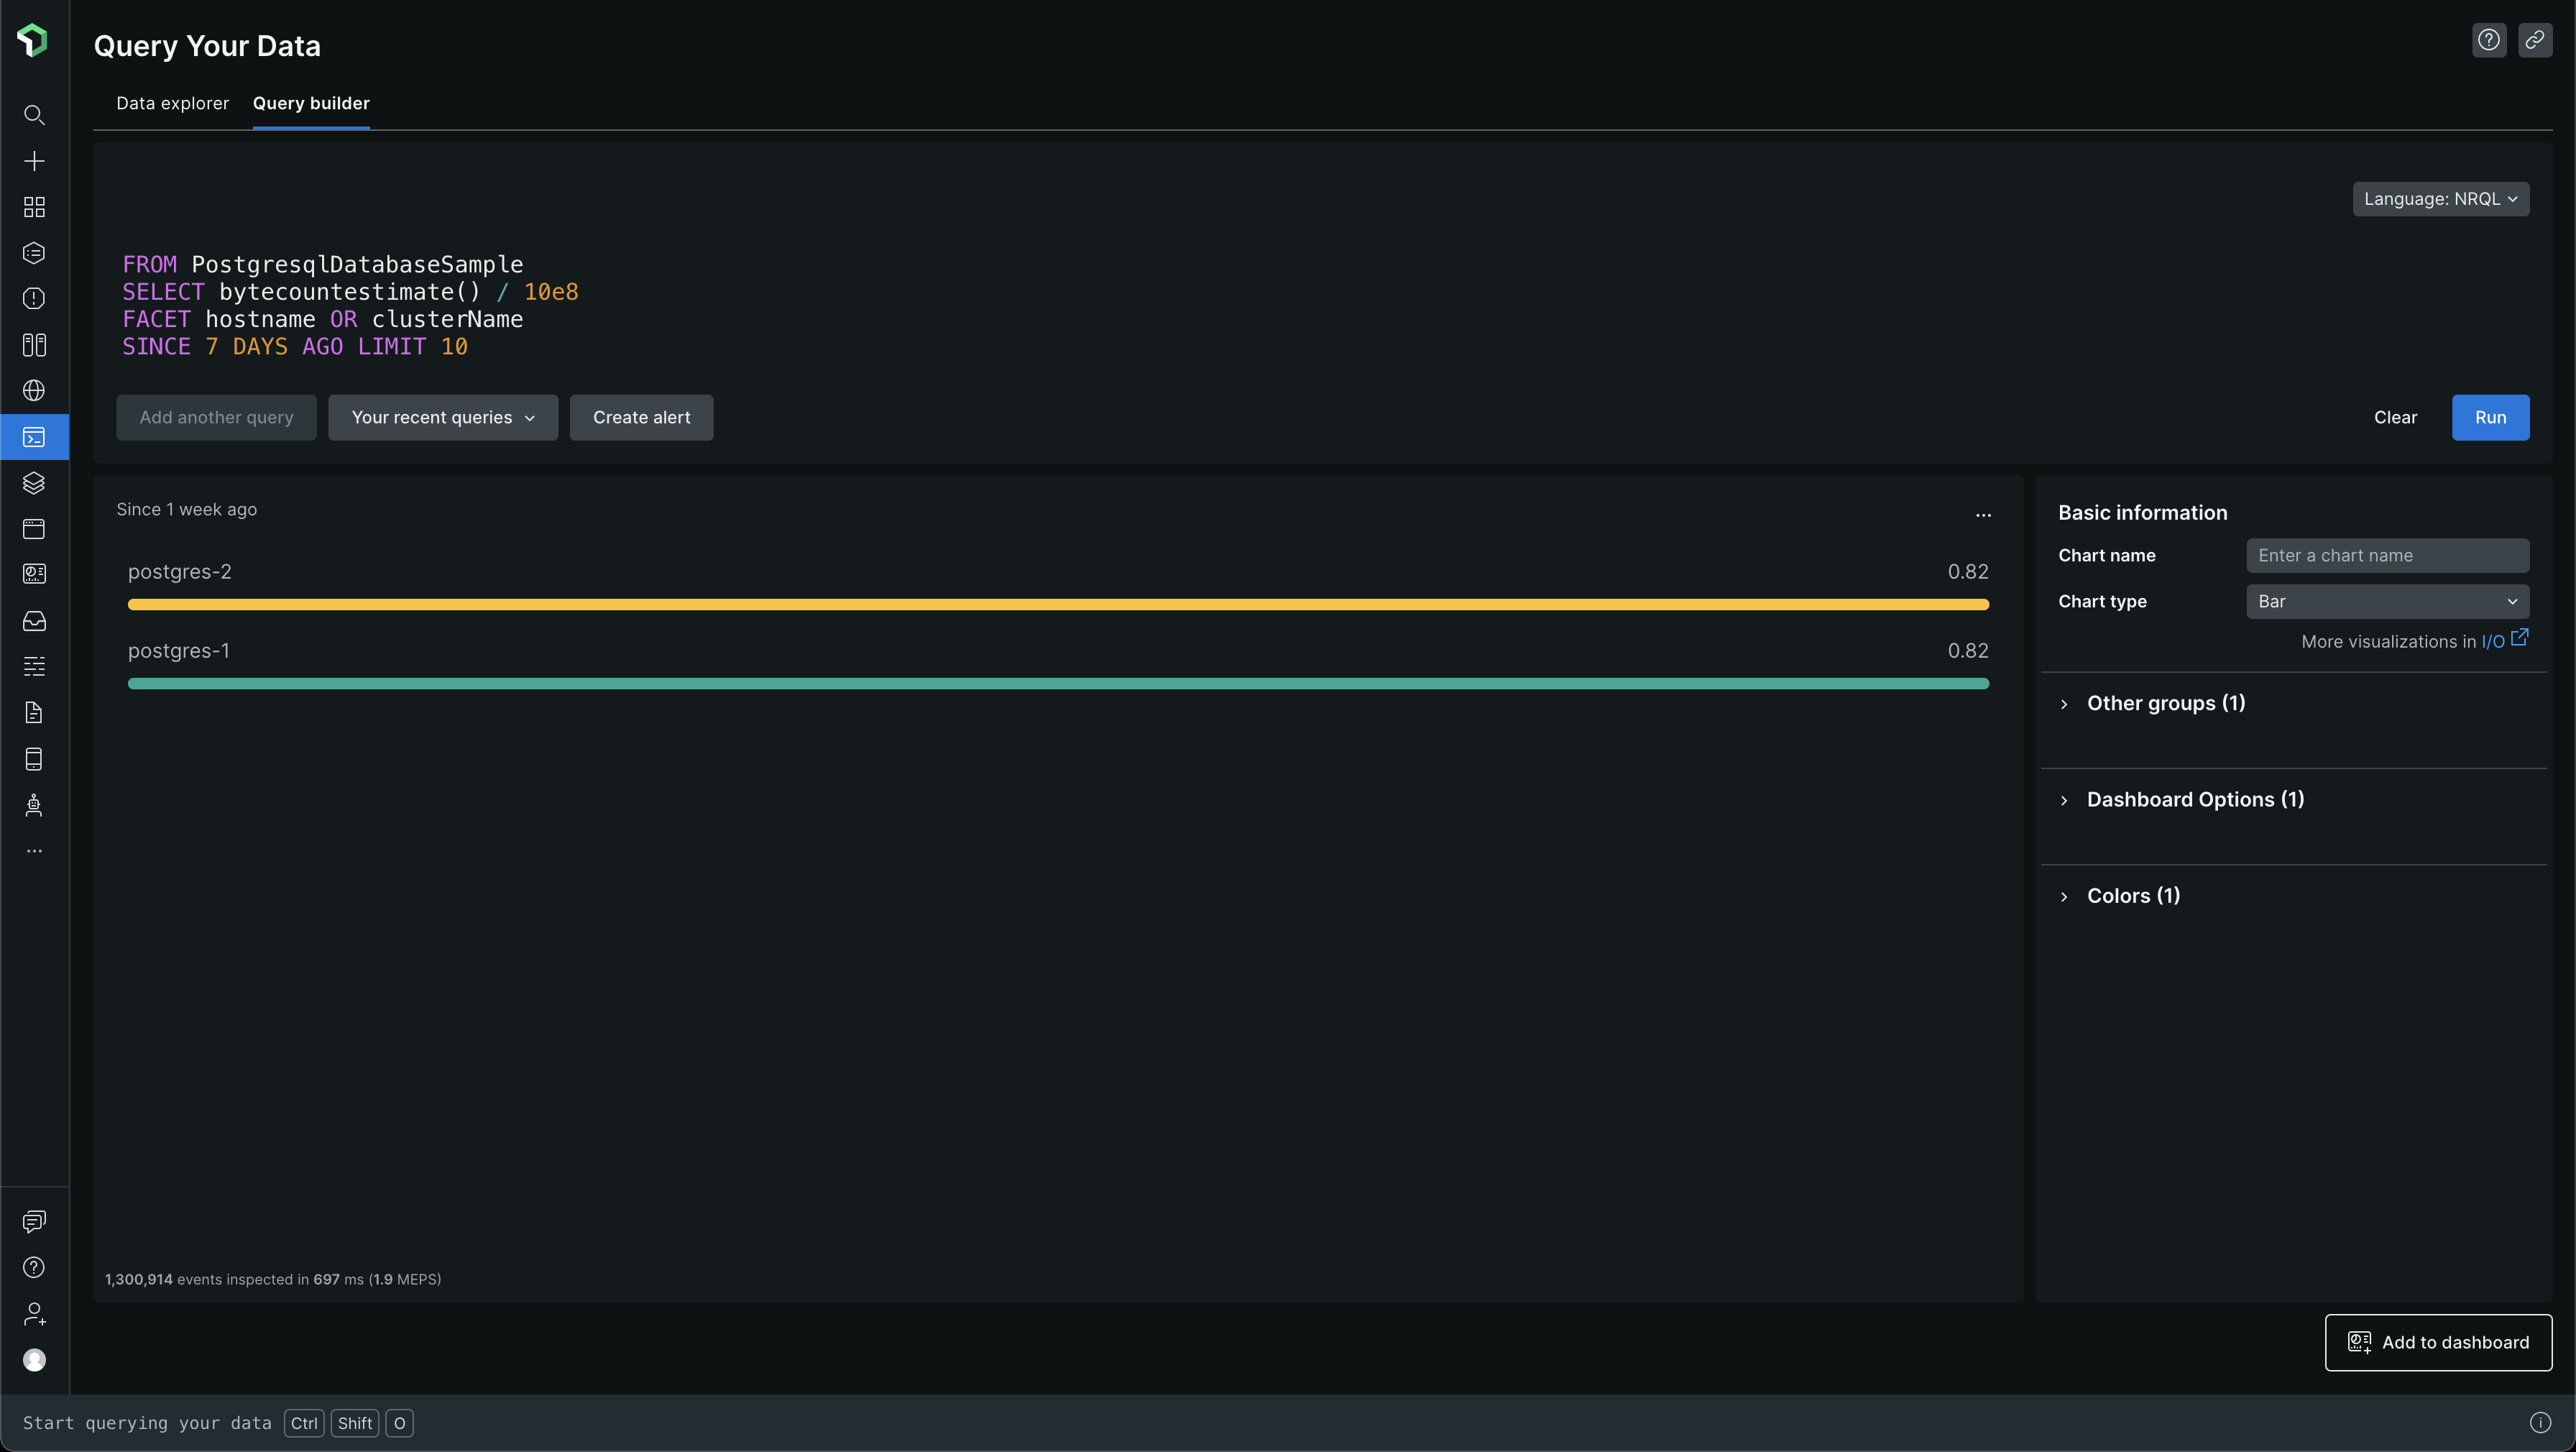
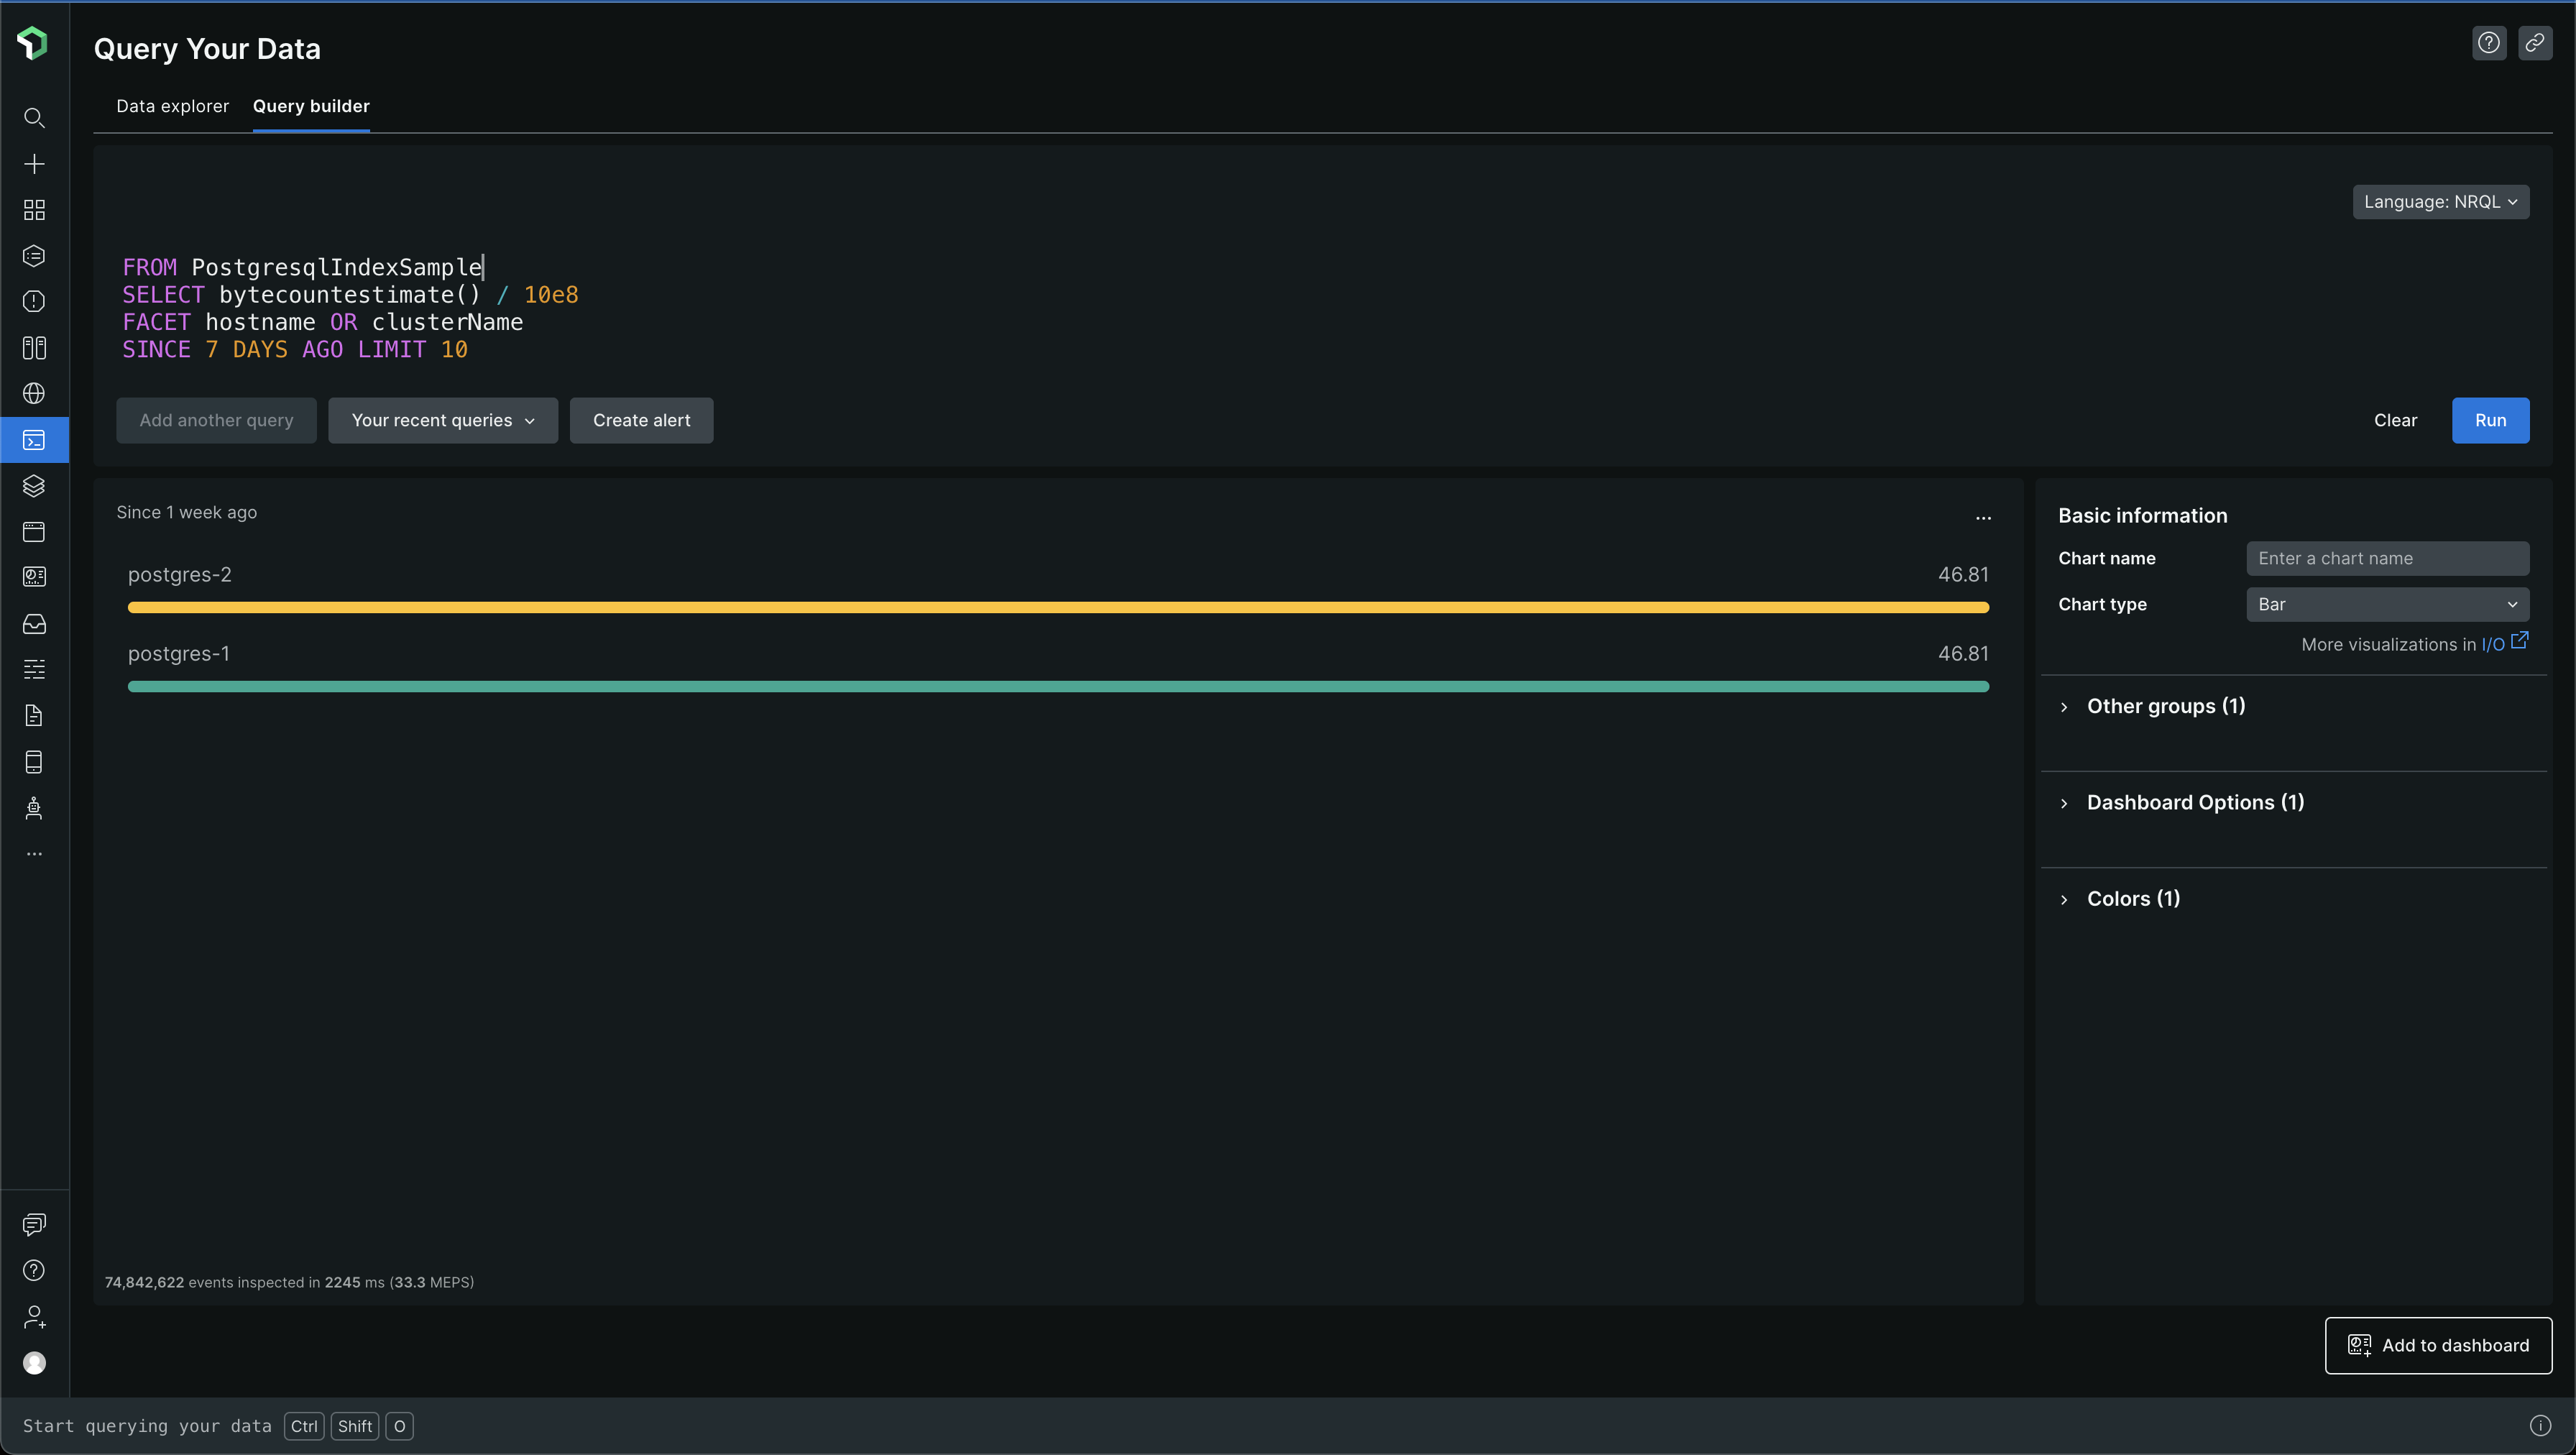
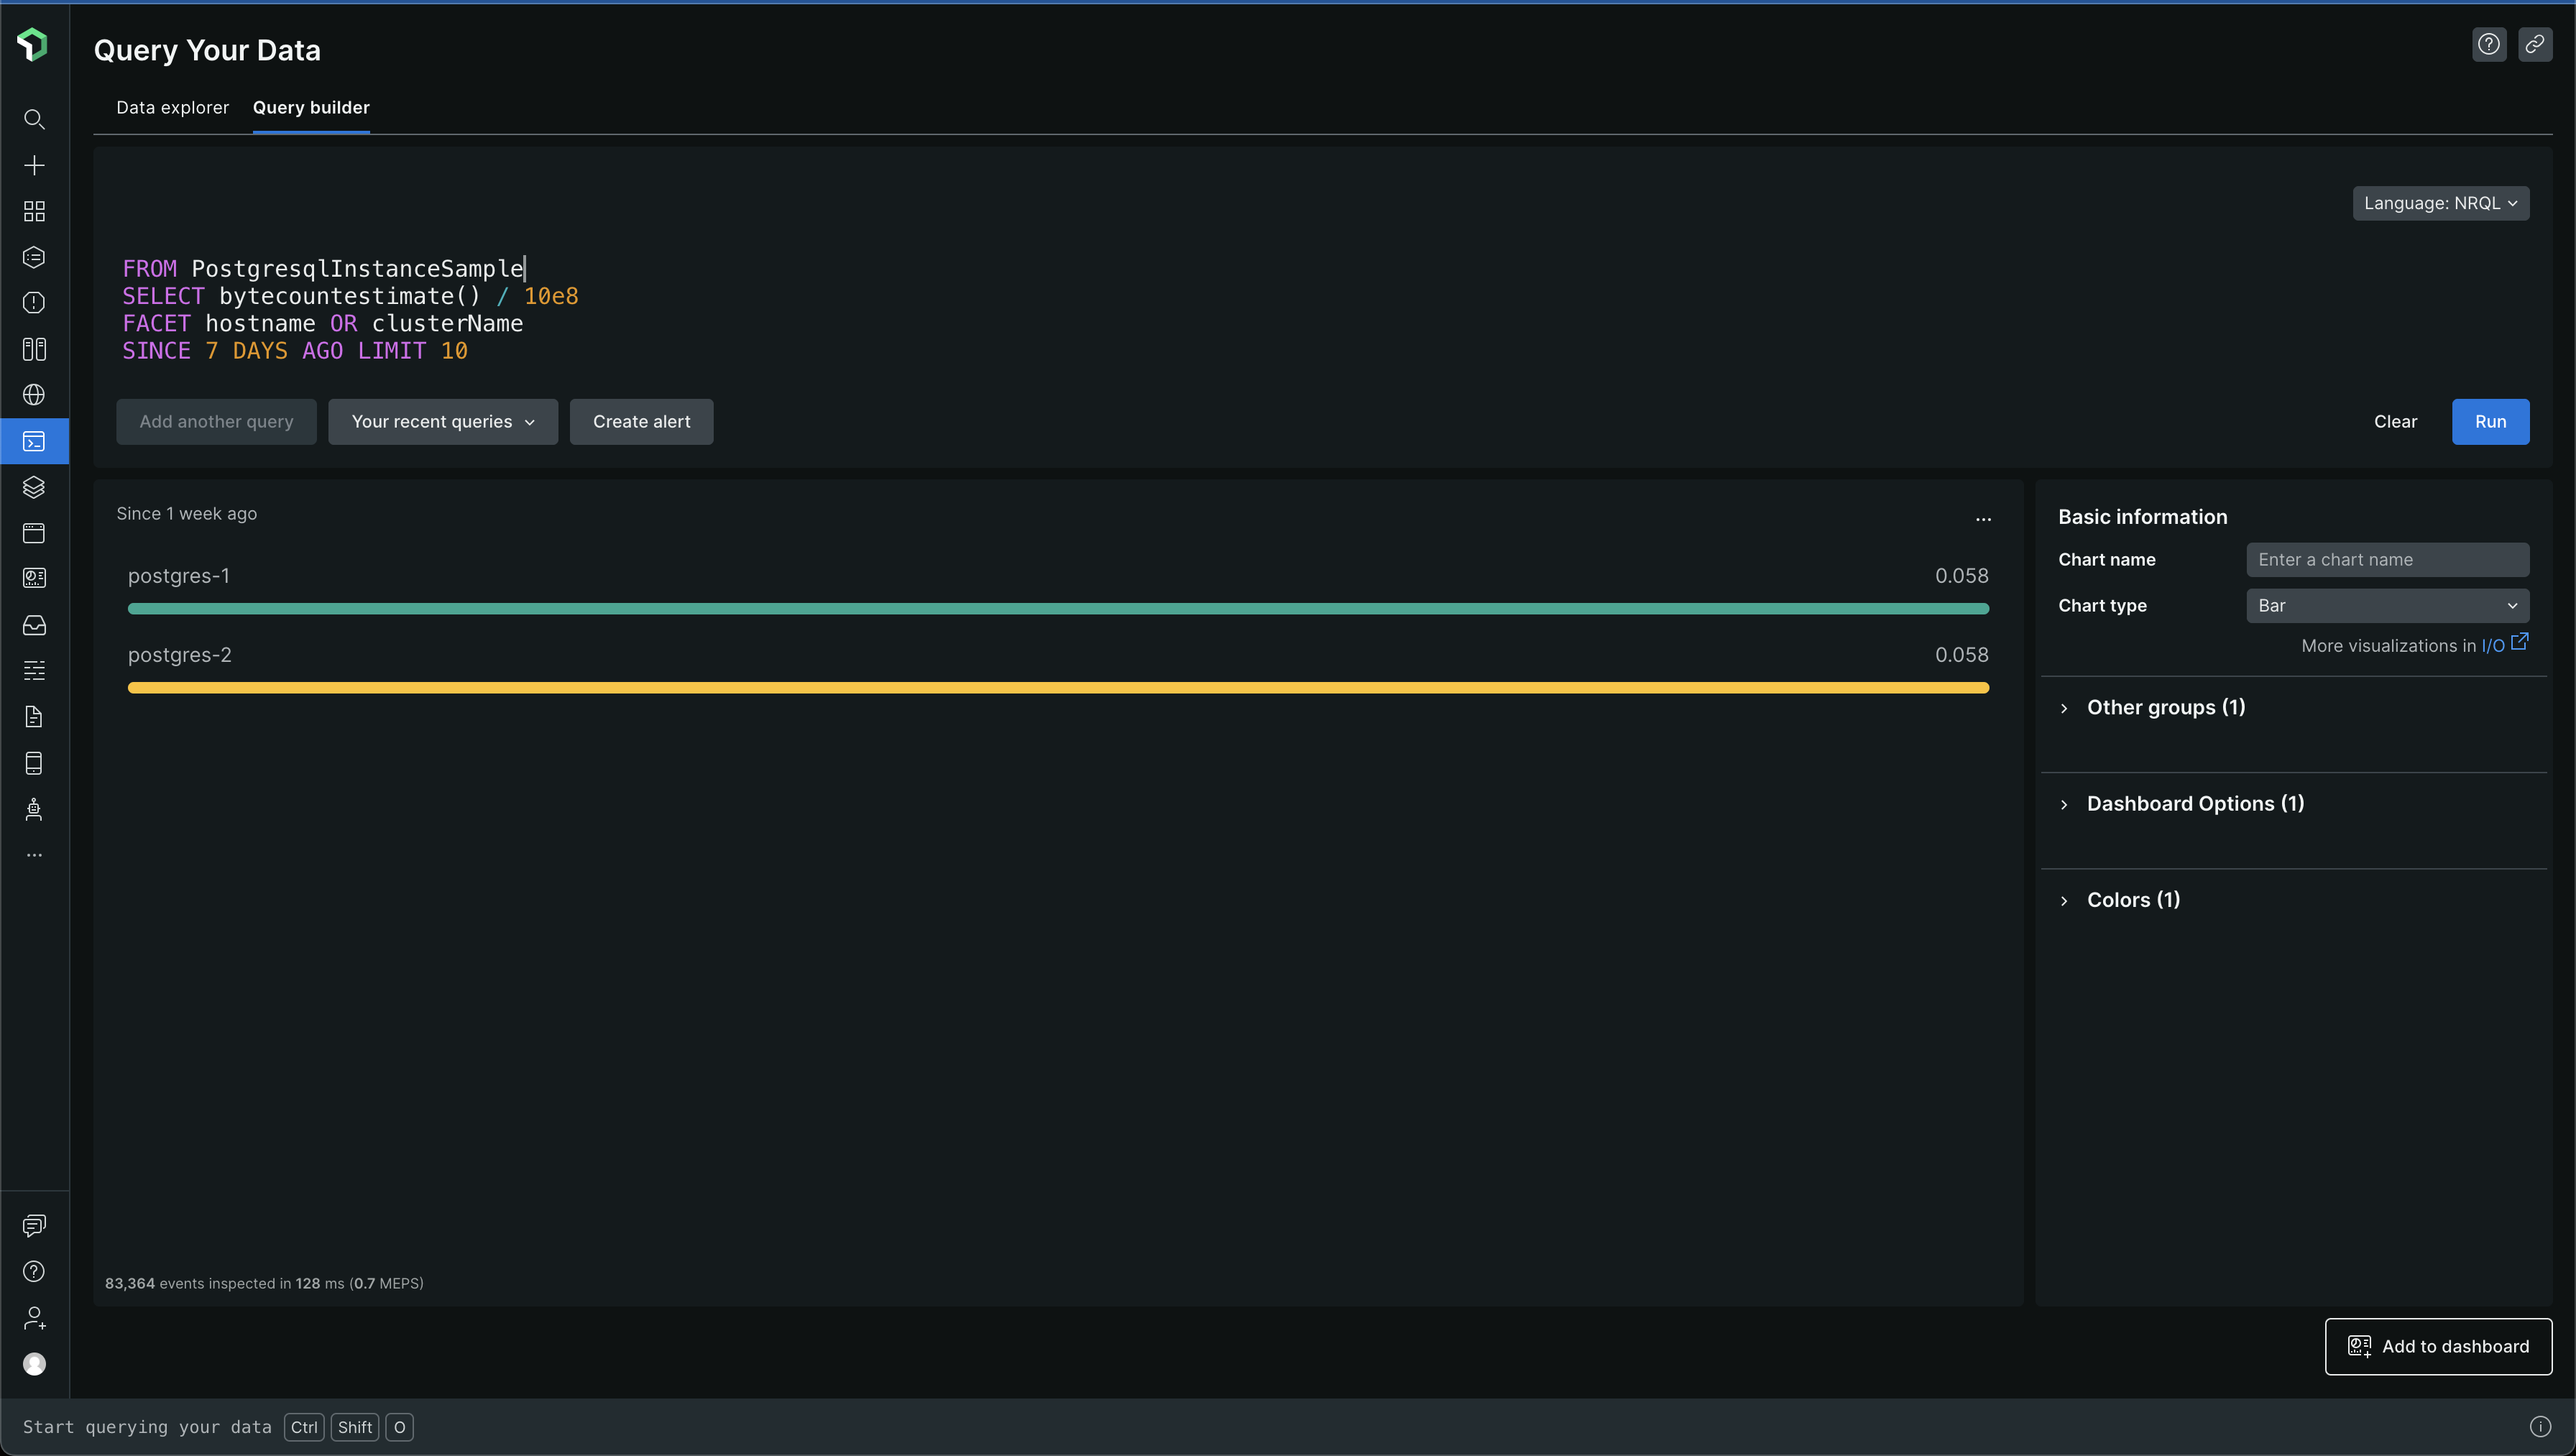
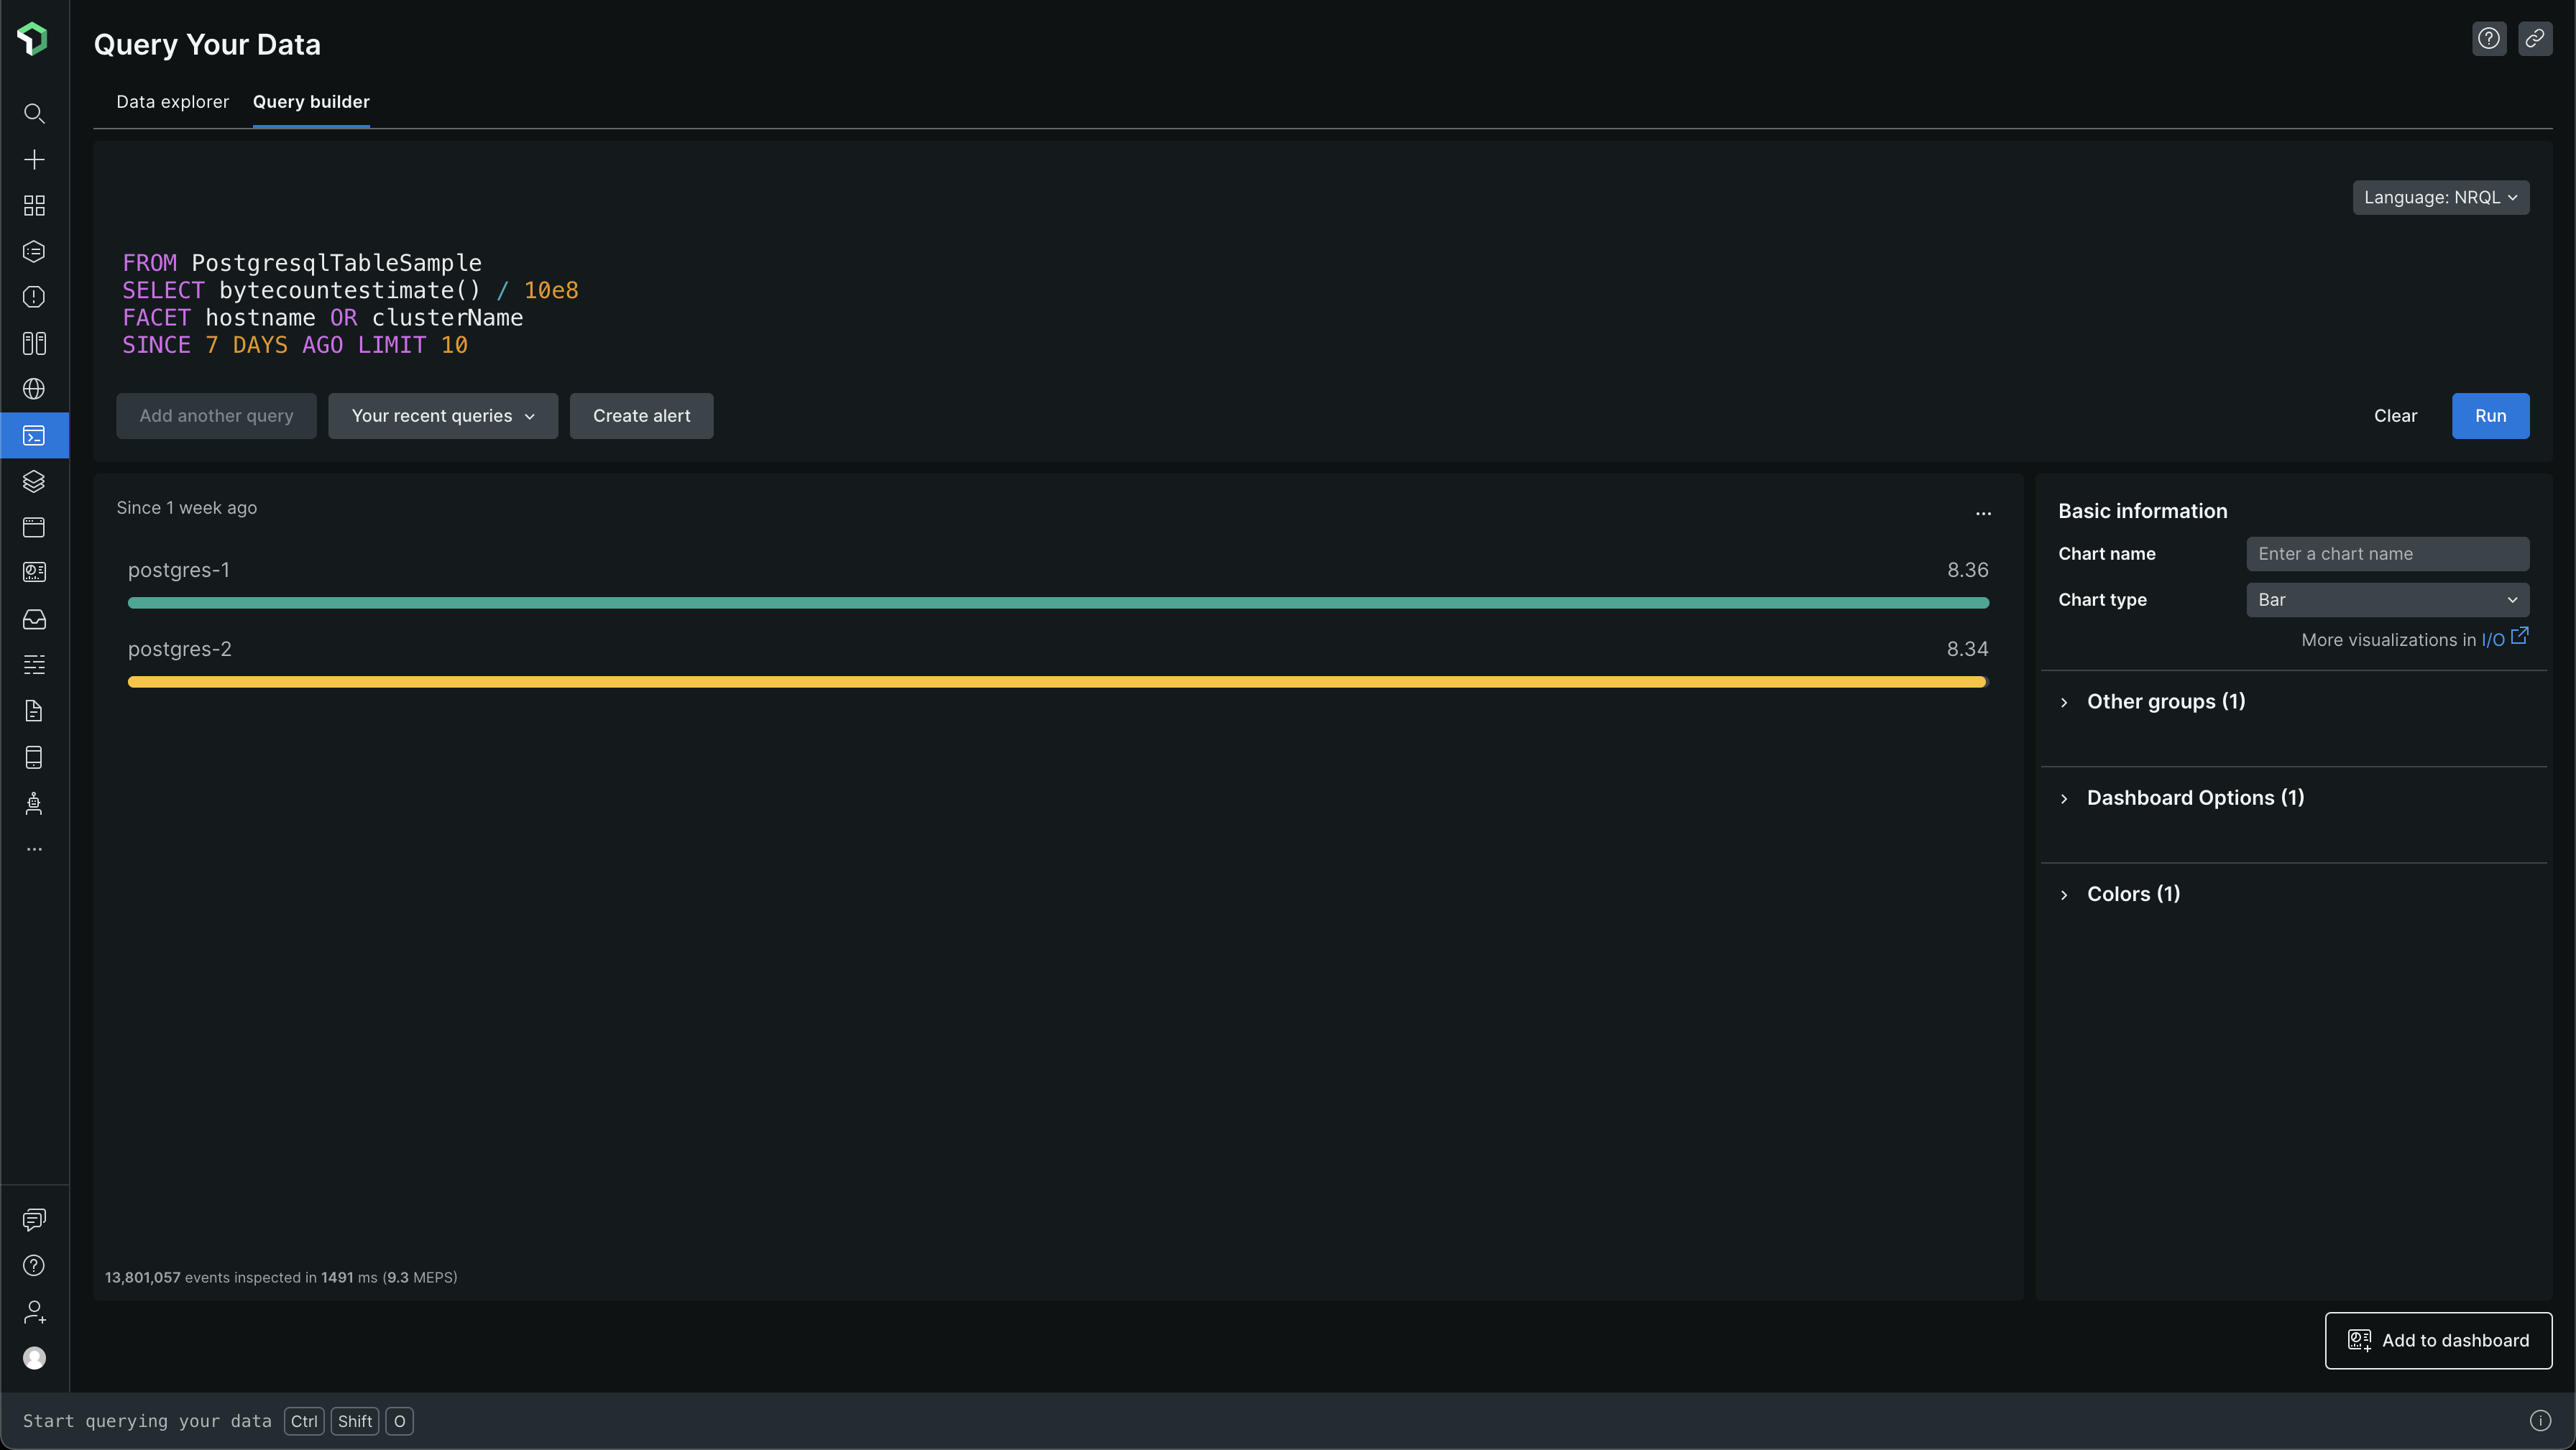
From the above data, we can see that PostgresqlIndexSample and PostgresqlTableSample events are pretty big. The others are pretty small and there is no data for PgBouncerSample - we don't even use PgBouncer, so, it makes sense 😅. The data is all in GBs again
PostgresqlIndexSample makes up for ~47 GB of data per week and PostgresqlTableSample makes up for ~8 GB of data per week. So, that's where most of the 56GB of data is coming from. That's a lot of data in a week, and when you extrapolate it into a month, due to the steady ingestion of data, you get large numbers which cause the bills to go high
Now, do we use all this data? From what I know, no. Then why ingest it in the first place? Exactly. I don't think we currently have any PostgreSQL dashboards, which we use, which are powered by this data. We also don't have any alerts set up based on these metrics
So, I started questioning what we get from this integration - why do we even need it? Well, it's like doing basic monitoring and observability - setting up the basics to use it for later when needed. Sure, this data is not being used today, but who's to say when it will be used? Well, for now, I'm thinking of getting rid of too much data and just keeping something minimal and when my team members want more data, 📈📉📊 dashboards and alerts 🚨‼️🔔 around PostgreSQL, then we can come back and revisit this
I was trying to look at the New Relic PostgreSQL integration config YAML file to see what's going on and how to control what data gets sent to New Relic, through the PostgreSQL integration config YAML, so that I can reduce the data, especially PostgresqlIndexSample and PostgresqlTableSample event data
The configuration YAML has this one field called COLLECTION_LIST. A pretty important field in our case
#
# If it is a JSON array, it will be interpreted as a list of database names to
# collect all related metrics from. This will collect metrics for each database
# specified, as well as all tables and indexes that belong to that database.
# Example:
# COLLECTION_LIST: '["postgres"]'
#
# If it is a JSON object, you can more finely tune the entities that are collected.
# Only the entities that are specified in the object will be collected. No automatic
# discovery will be performed.
# The levels of JSON are database name -> schema name -> table name -> index name
# Example:
# collection_list: '{"postgres":{"public":{"pg_table1":["pg_index1","pg_index2"],"pg_table2":[]}}}'
COLLECTION_LIST: '["postgres"]'

# JSON array of database names that will be ignored for metrics collection.
# Typically useful for cases where COLLECTION_LIST is set to 'ALL' and some databases need to be ignored.
# Defaults to empty '[]'.
# Example:
# COLLECTION_IGNORE_DATABASE_LIST: '["azure_maintenance","azure_sys"]'
#
# COLLECTION_IGNORE_DATABASE_LIST: '[]'
If someone gives ALL as the value for COLLECTION_LIST, then they should think about the question "Do I want all this data, though?". When ALL is mentioned, information around all databases, all schemas, all tables and all indexes are collected and sent to New Relic
There are a lot of valid values for the COLLECTION_LIST config. This config's valid values are present in the sample config YAML files
postgresql-config.yml.sample (master) or postgresql-config.yml.sample (specific commit)
postgresql-config.yml.k8s_sample (master) or postgresql-config.yml.k8s_sample (specific commit)
Surely ALL is a bad idea. It takes up every data in the postgres and other databases in the PostgreSQL instance server. Every data meaning - every database - every schema - every table - every index in the tables
I wanted to understand more about this field and how it's used by nri-postgresql. To understand better, the best place to look at is the code. So I looked at the code for nri-postgresql New Relic Integration for PostgreSQL. For example, the code in here - collection.go - the function at Line 40
I was looking at the usage of CollectionList code which is related to the COLLECTION_LIST field in the config YAML, i.e. they are mapped
I was also looking at how the different kinds of values are parsed - ALL vs List of database names vs a detailed JSON object with details on which metrics to send for which entities, entity meaning - database, schema, table, index
ALL ingests all data, so no, I don't want that for now
List of database names - this also ingests all the data from the list of databases given. I could use this and give an empty list - but then I would get no data from the PostgreSQL. It's okay for now since we aren't using the metrics from it. But I wanted some basic data to be there
Detailed JSON object - I can use this. I can just put in the database name to get PostgresqlDatabaseSample which is very little and basic data for now. Also, PostgresqlInstanceSample comes regardless
I'm attaching references to the code I saw -
PopulateInstanceMetrics, PopulateDatabaseMetrics, PopulateTableMetrics, PopulateIndexMetrics
So, finally, I'm putting the value of COLLECTION_LIST as something like the following -
COLLECTION_LIST: '{"postgres":{},"users":{},"iam":{},"event_store":{},"time_series_store":{}}'
I haven't changed the interval though, though I think that will also affect the amount of data being ingested - due to sampling often (low interval). The current interval is 15 seconds and I have left it as is for now
After the change and restart of the New Relic Infrastructure agent, to ensure latest Postgres integration config changes are reflected, I can see that the index and table samples are not being ingested anymore
Index - PostgresqlIndexSample -
FROM PostgresqlIndexSample SELECT bytecountestimate() / 1e9 TIMESERIES
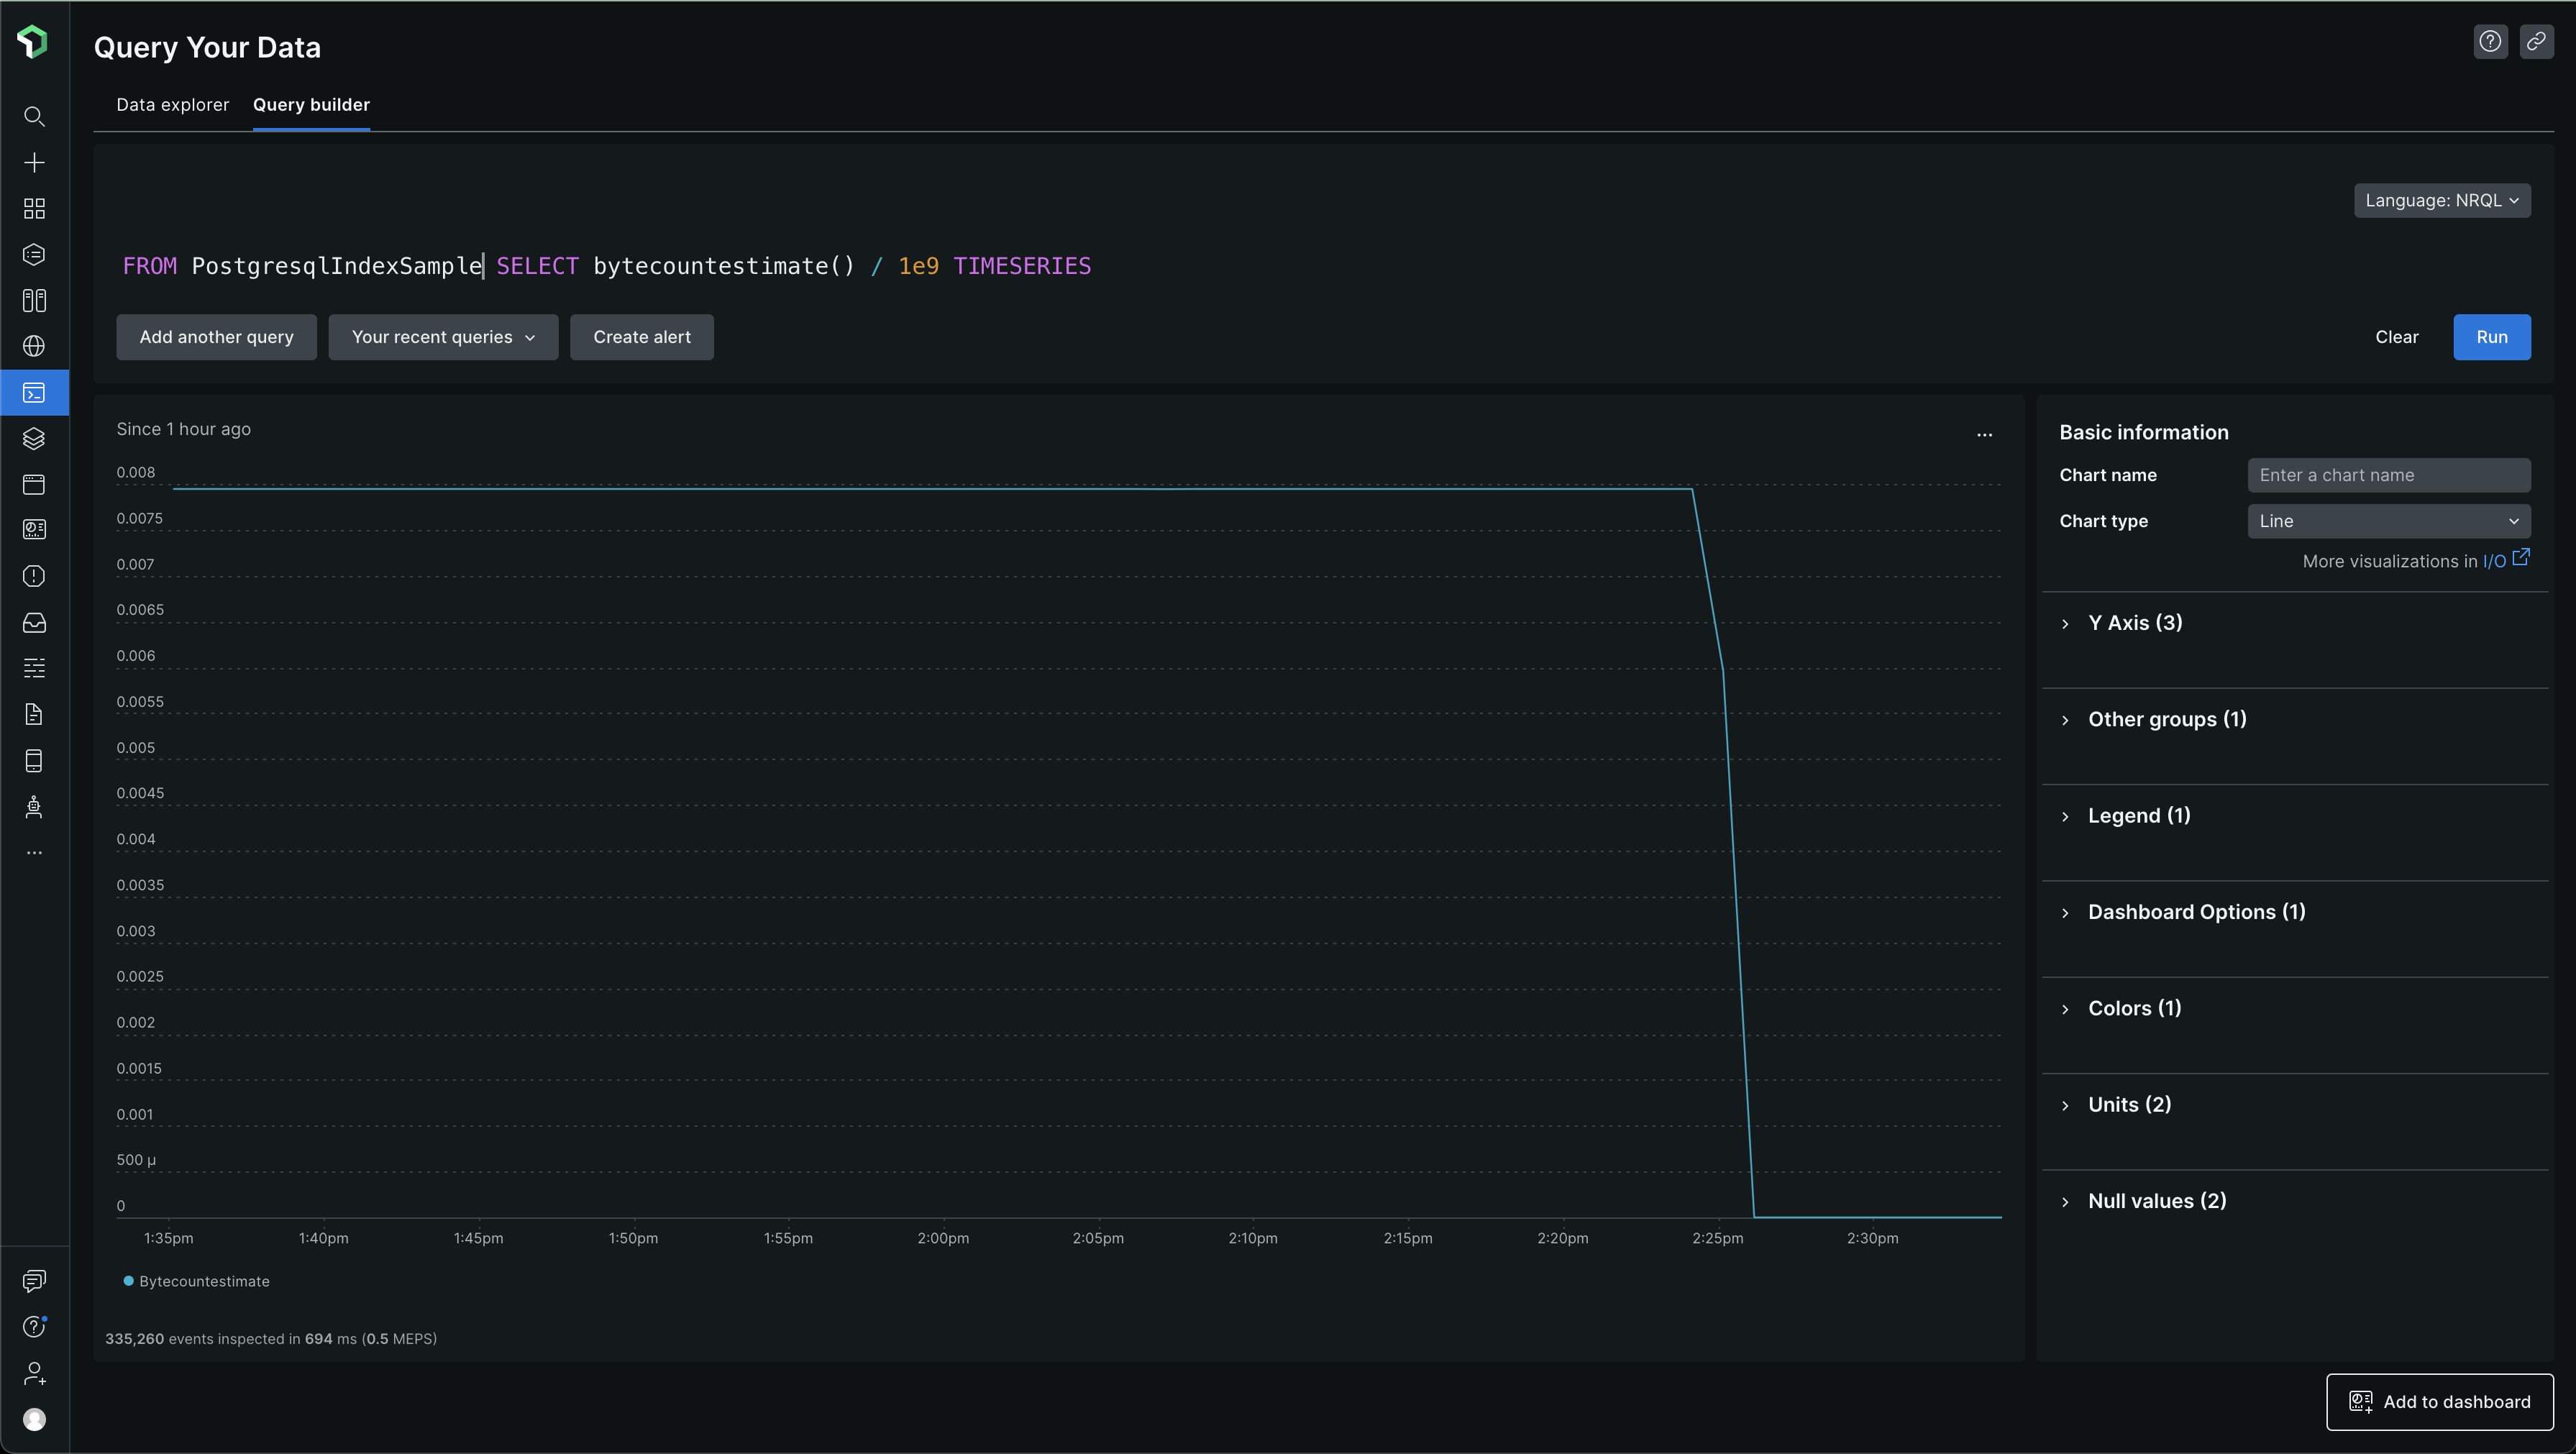
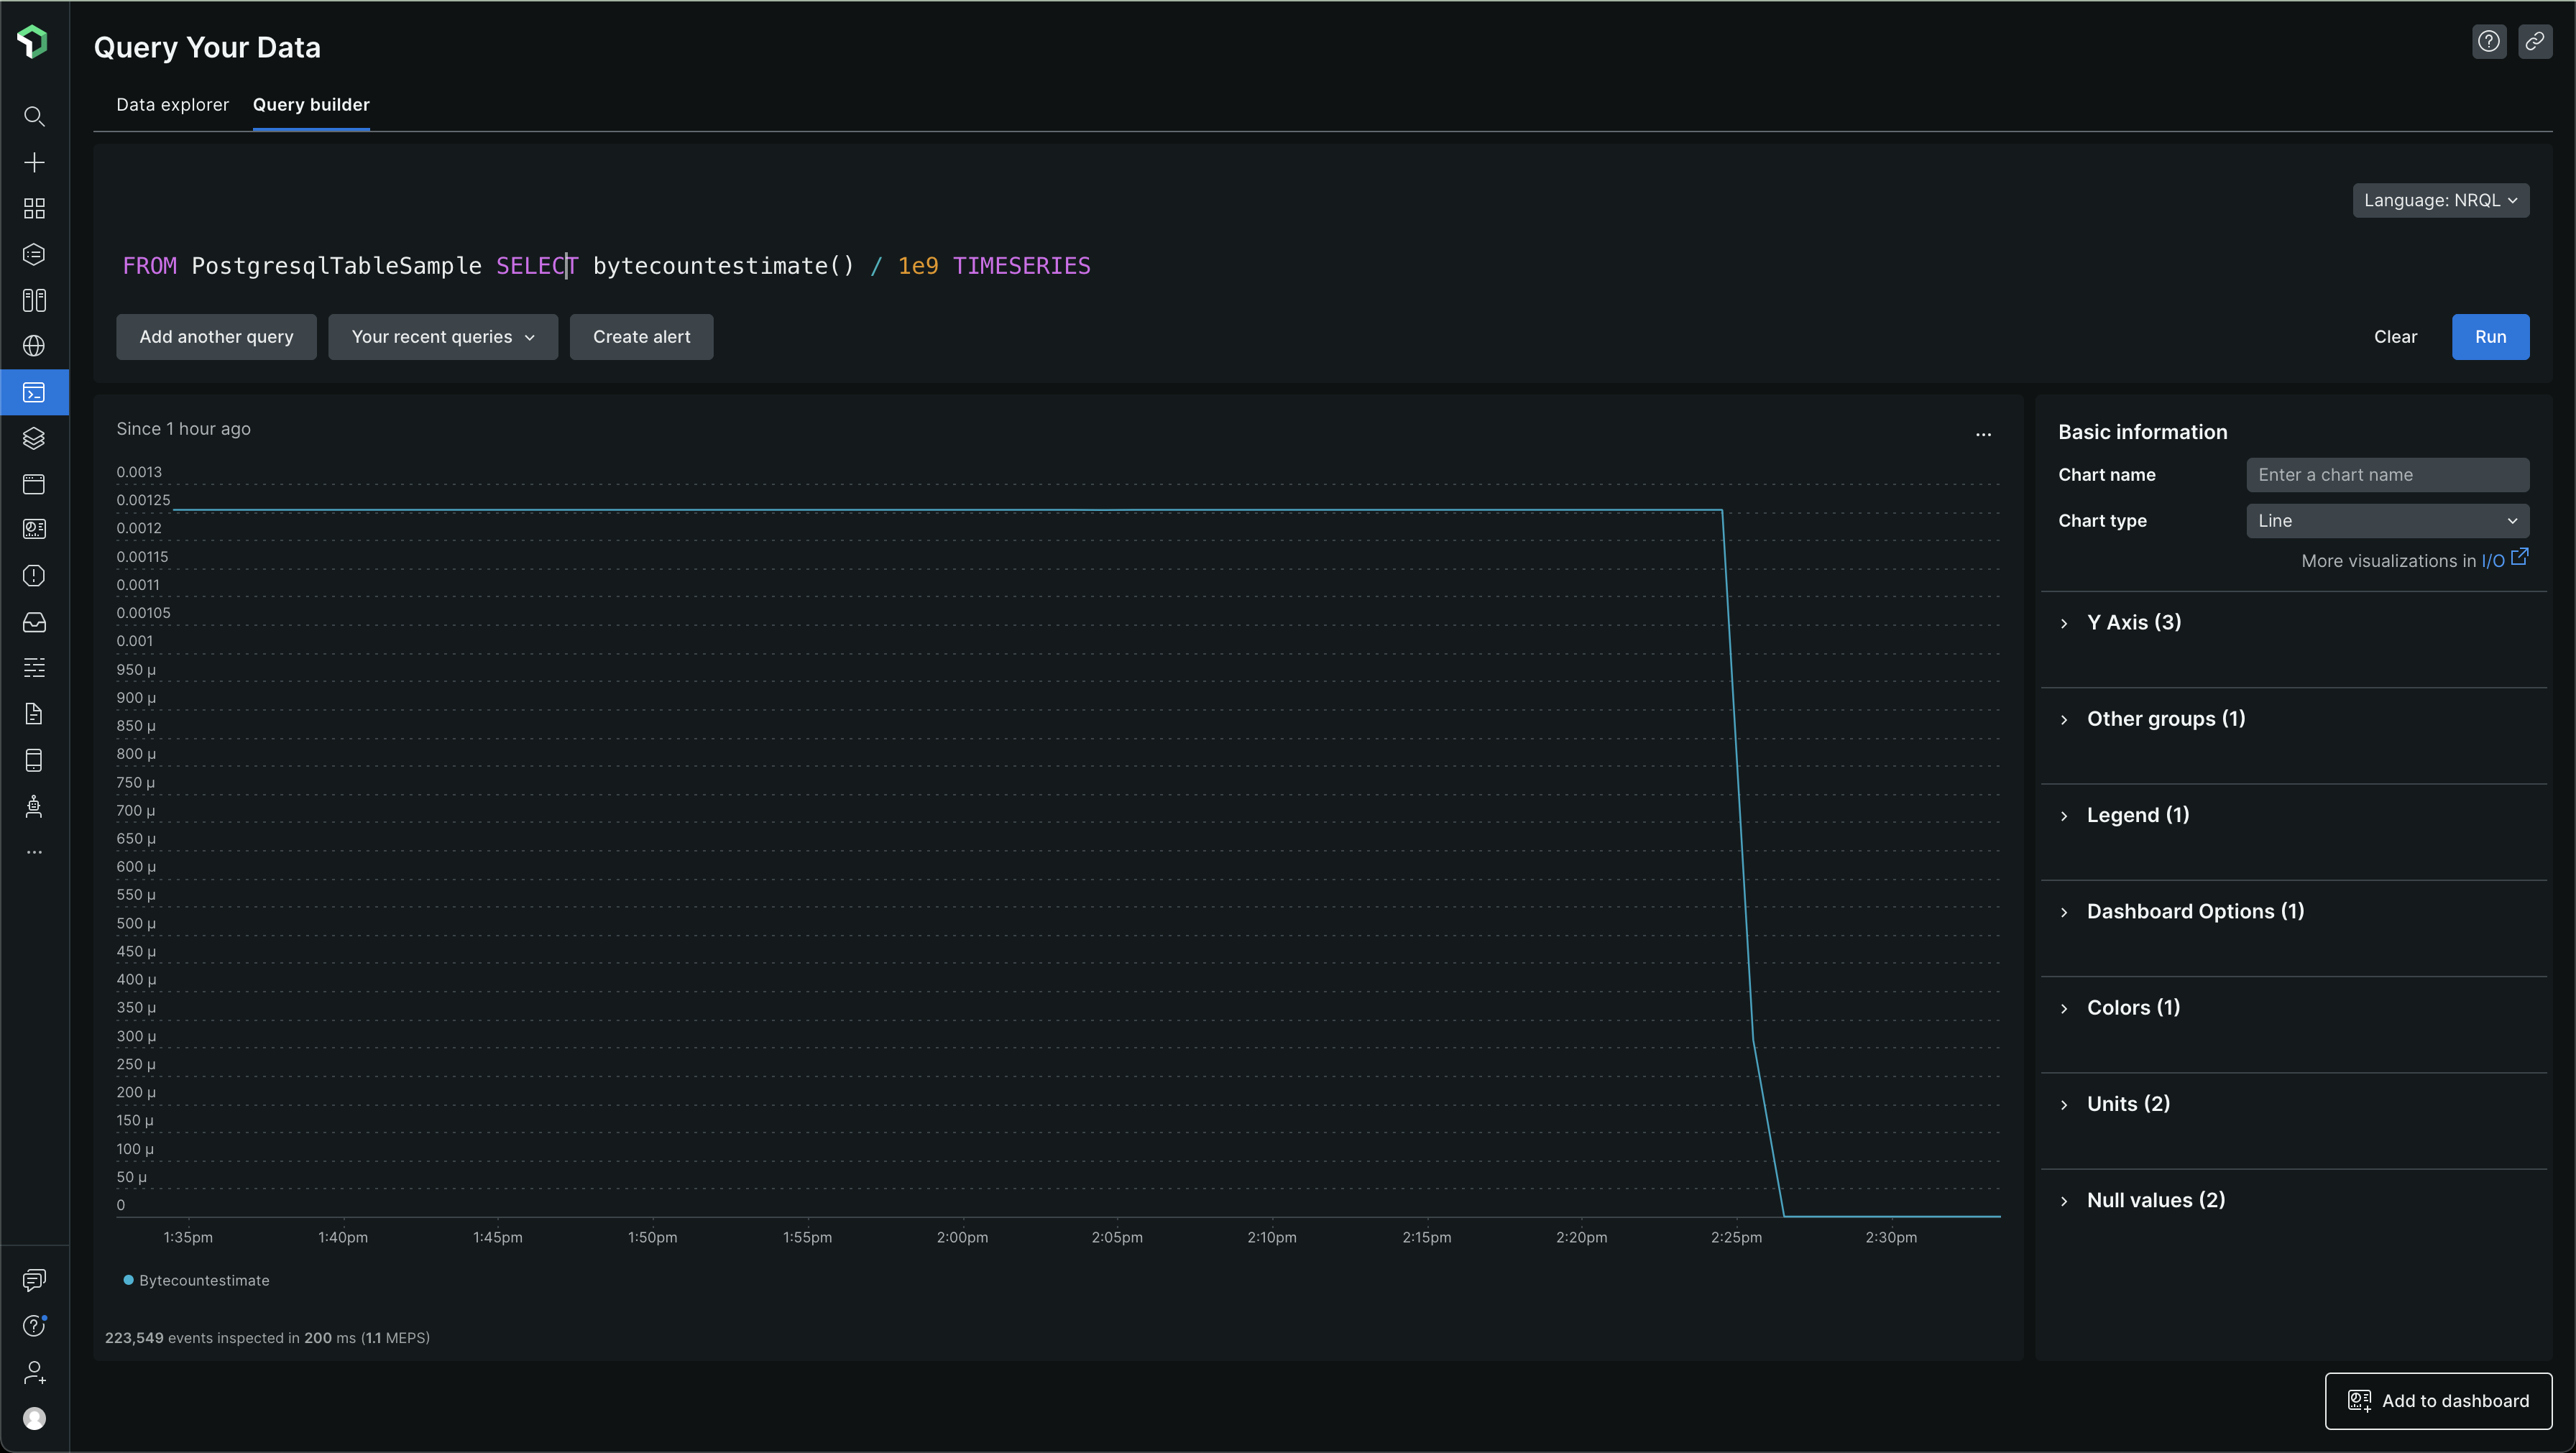
Table - PostgresqlTableSample -
FROM PostgresqlTableSample SELECT bytecountestimate() / 1e9 TIMESERIES
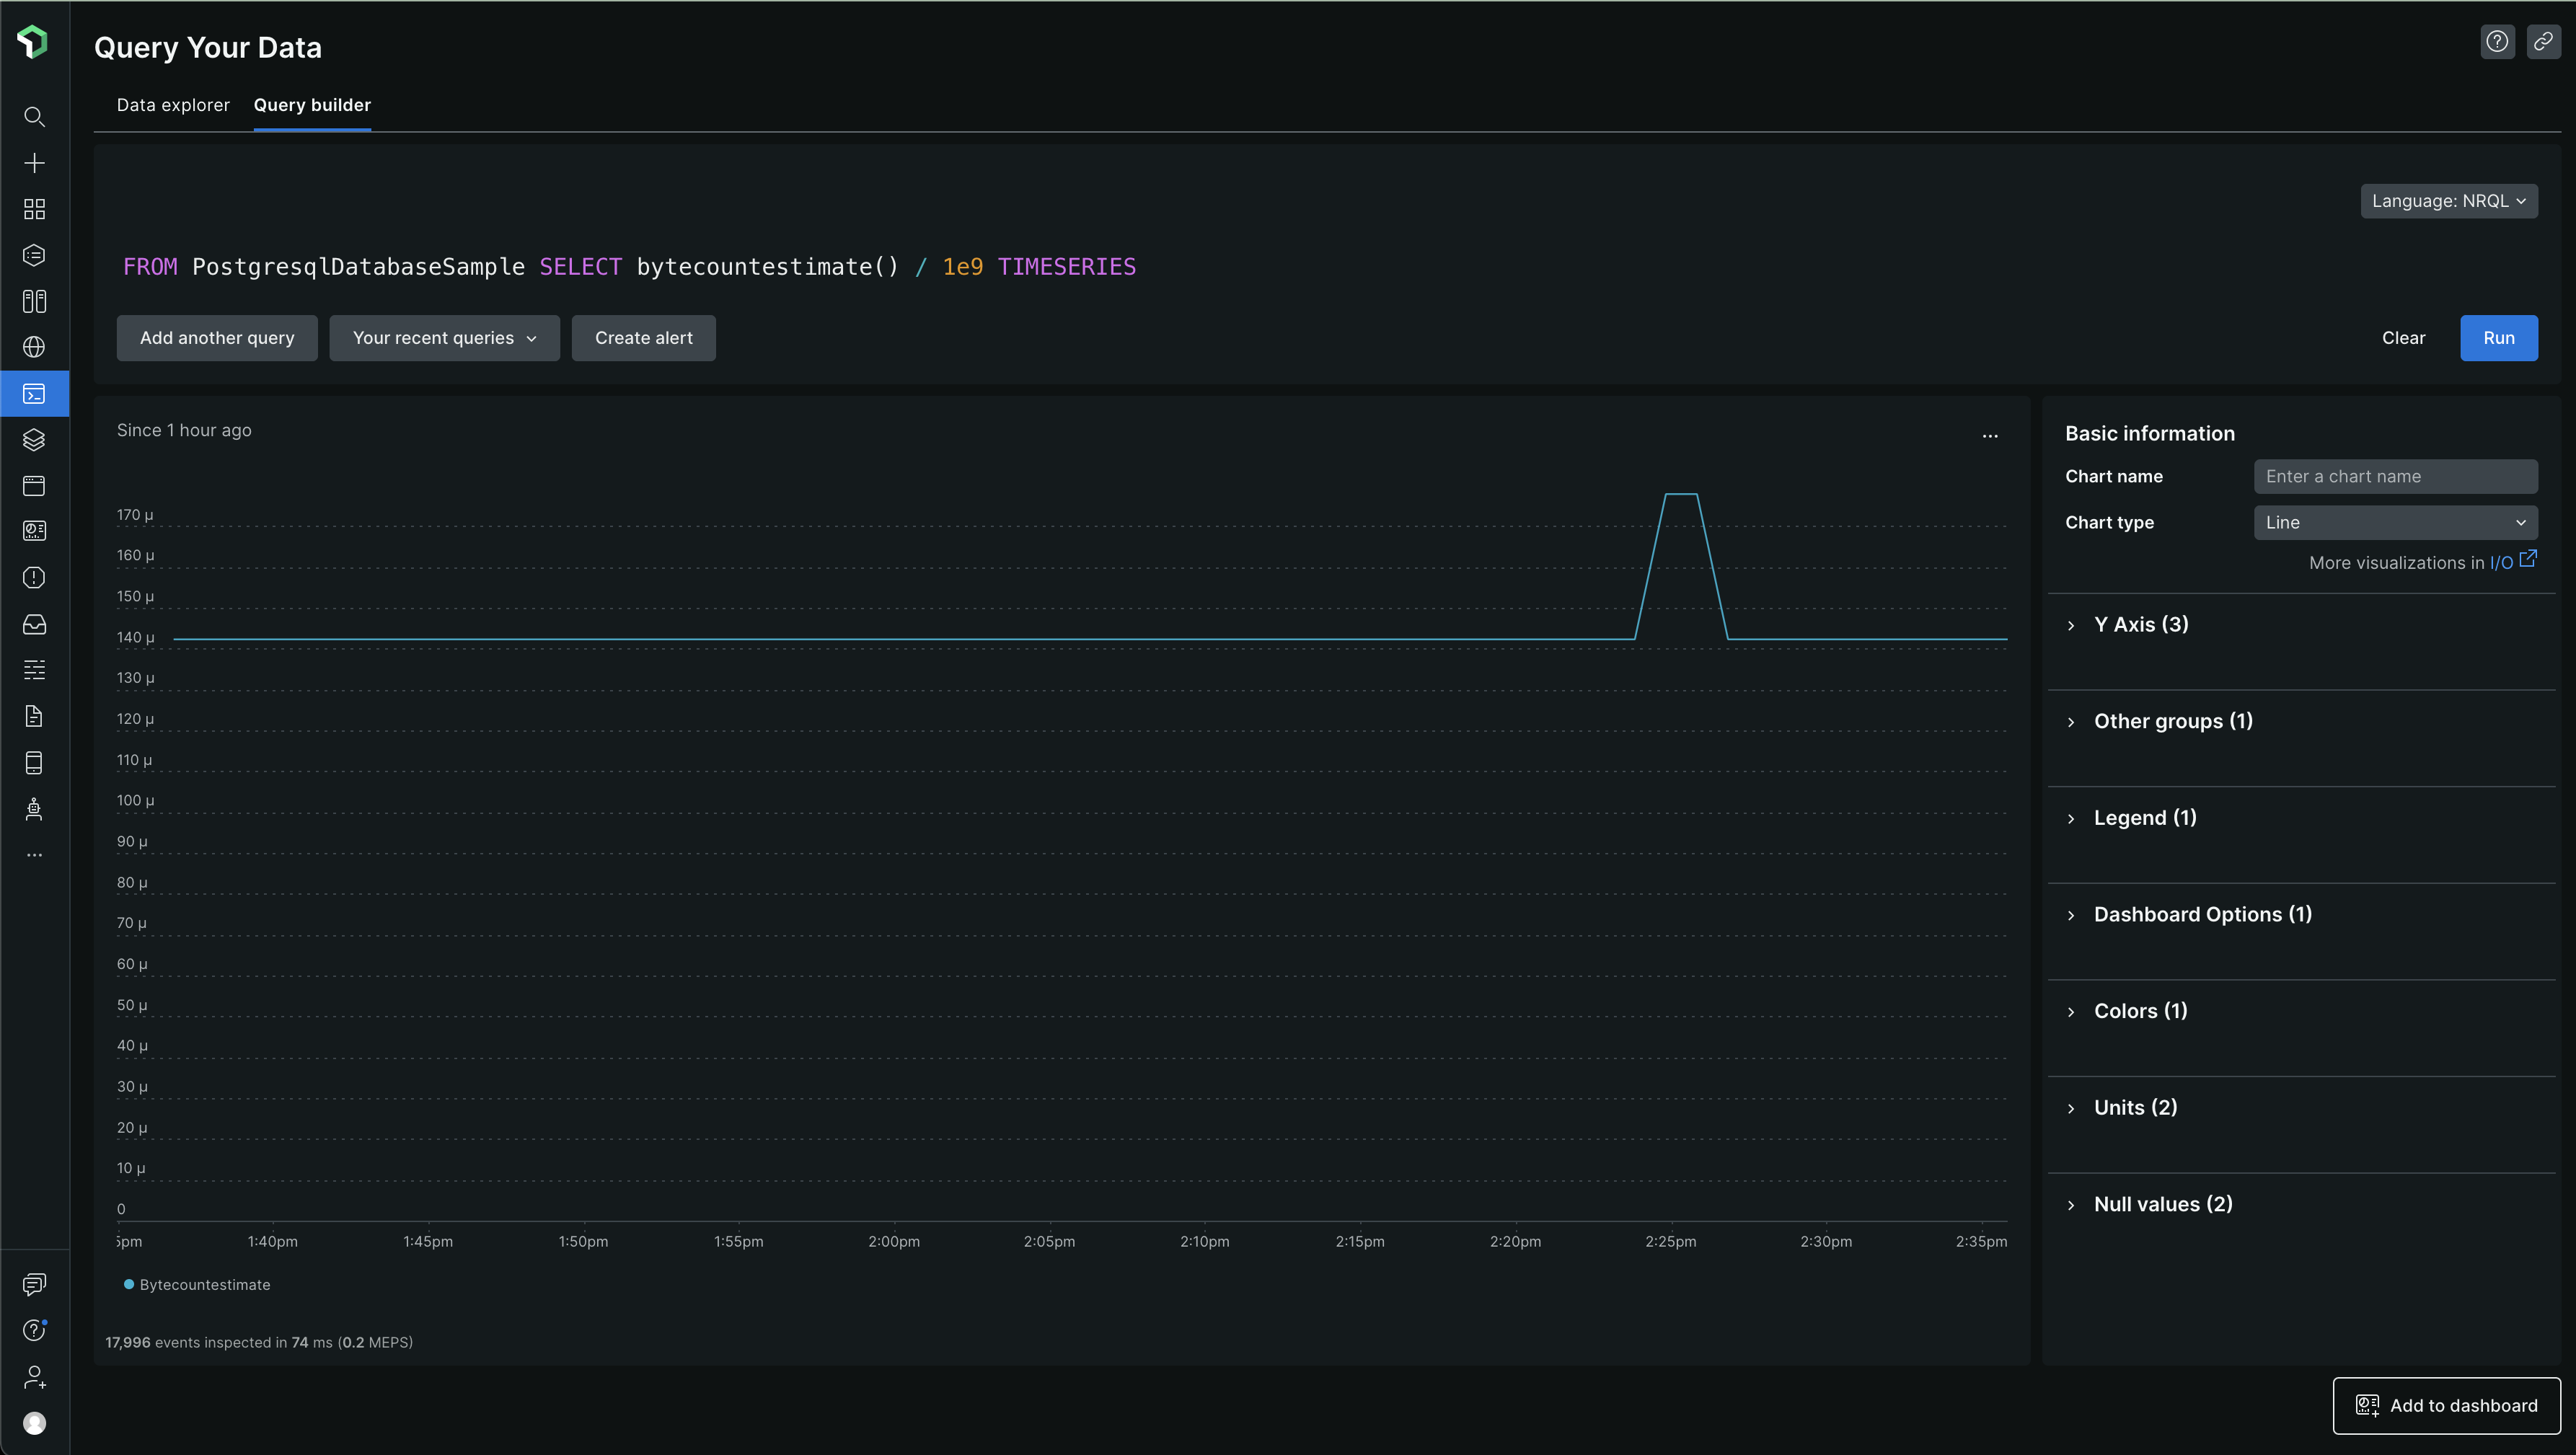
Others are fine. PostgresqlDatabaseSample - some very basic data still getting ingested -
FROM PostgresqlDatabaseSample SELECT bytecountestimate() / 1e9 TIMESERIES
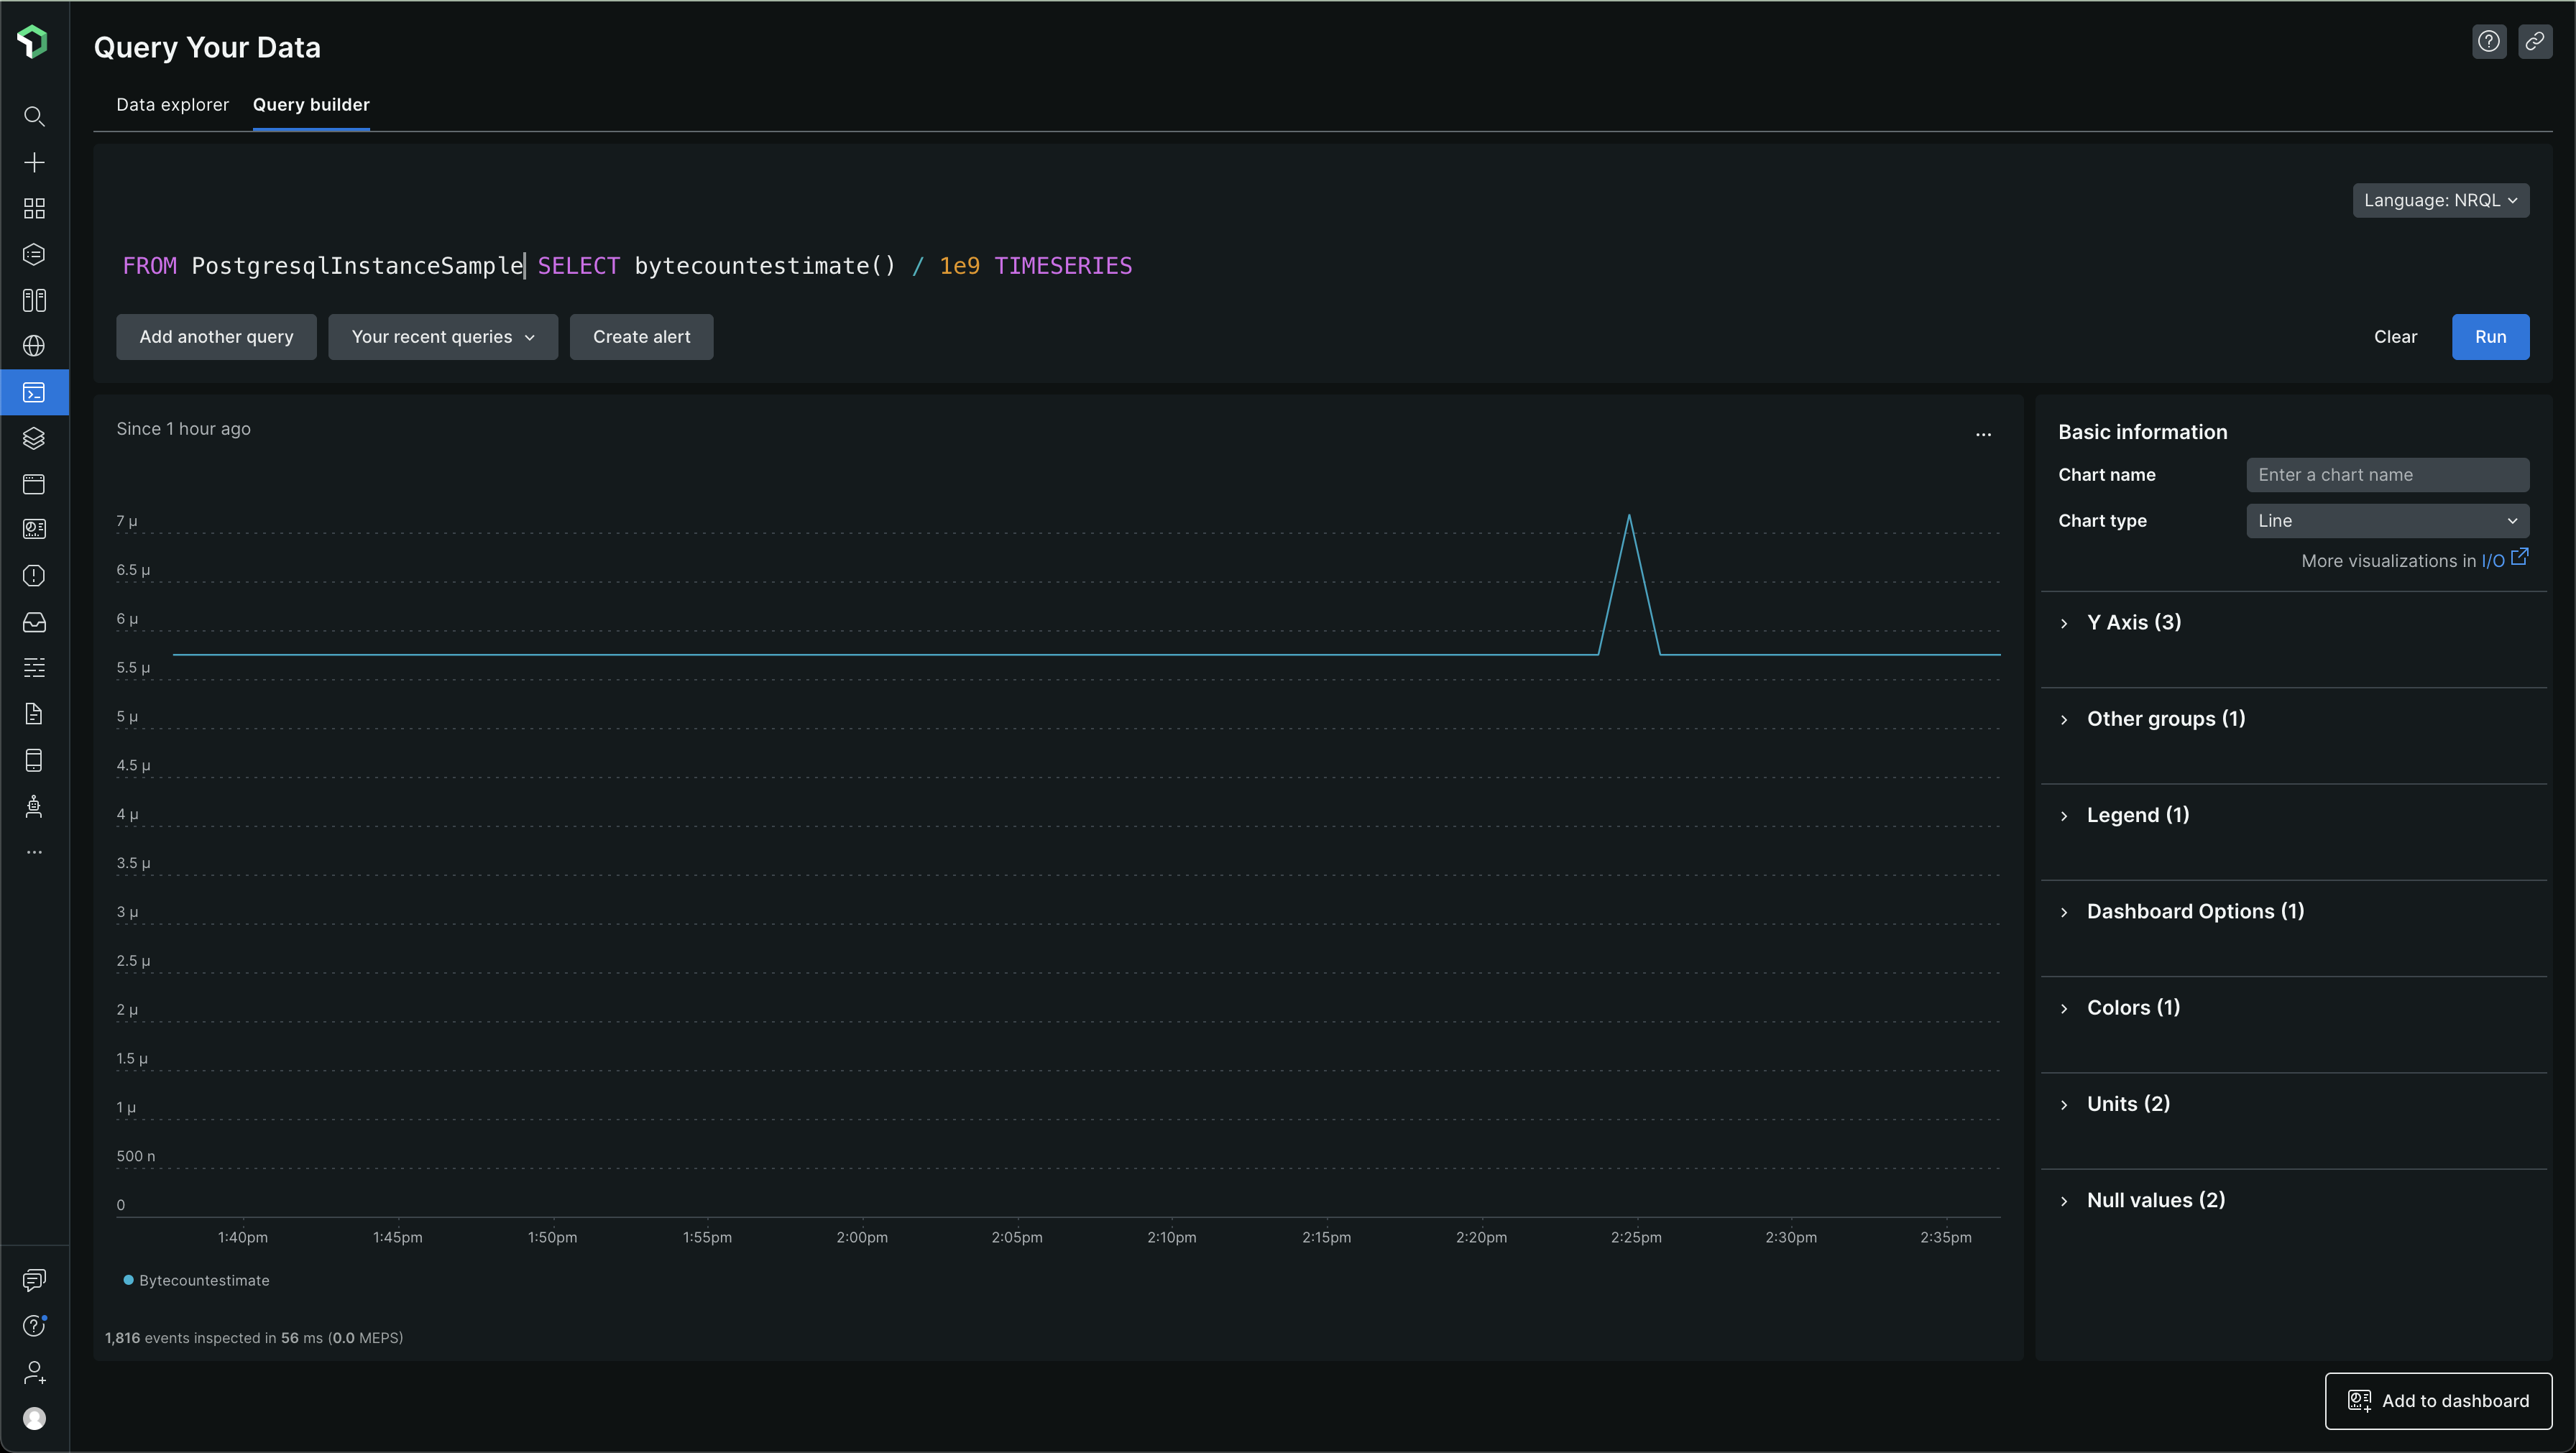
PostgresqlInstanceSample -
FROM PostgresqlInstanceSample SELECT bytecountestimate() / 1e9 TIMESERIES
I'm gonna be making this change in all our environments so that the bills are lower for now and when we do decide to ingest more data, to track and monitor some more things, we can decide what specific databases to monitor, which schemas, which tables and which indices :)
References:
The following are some of the high-level links I followed at the time of this writing ✍️ 🖋️ ✒️