🔎 Making sense out of New Relic platform 🔍
K
I like learning new stuff - anything, including technology. I love tinkering with new tools, systems and services, especially open source projects
Search for a command to run...
I like learning new stuff - anything, including technology. I love tinkering with new tools, systems and services, especially open source projects
No comments yet. Be the first to comment.
inodes is a concept in Linux. Oh wait…no Fun fact that I learned while experimenting on my macOS - I can see that the term and concept of inodes exists in the context of macOS too Looks like it’s a “Unix” thing and Linux and Darwin, both are Unix bas...

You can look for Kubernetes Preemption Events in your observability system assuming you are exporting your Kubernetes Events to some store like some time series DB or similar In our case, we use Prometheus and we have an exporter for exporting the Ku...

Recently, when I discovered the py-spy profiler took for Python, I also discovered Speedscope, which is visualization tool for visualizing performance data (performance profile etc). This is a flamegraph Visualization. I have something of this sort w...

So, today, we had an issue in one of our internal systems called API Tester. It was very slow. Only today it was slow, and the CPU usage was very high according to our monitoring systems, especially since today morning. Before noticing the CPU usage,...

If you have Prometheus running and scraping metrics - You can find Kubernetes list of features enabled information for every feature using kubernetes_feature_enabled metric which gives build information kubernetes_feature_enabled{} The name of the f...

We, at Togai, currently use New Relic as our primary monitoring and alerting platform. We send machine data (CPU, RAM metrics etc) and also application-specific data (ingestion service) to New Relic. New Relic crunches all this data and shows great visualizations (for example graphs) and also helps us add conditions to send alerts when a particular event happens (some data’s value rises etc)
URL to access the New Relic Platform: https://one.newrelic.com/
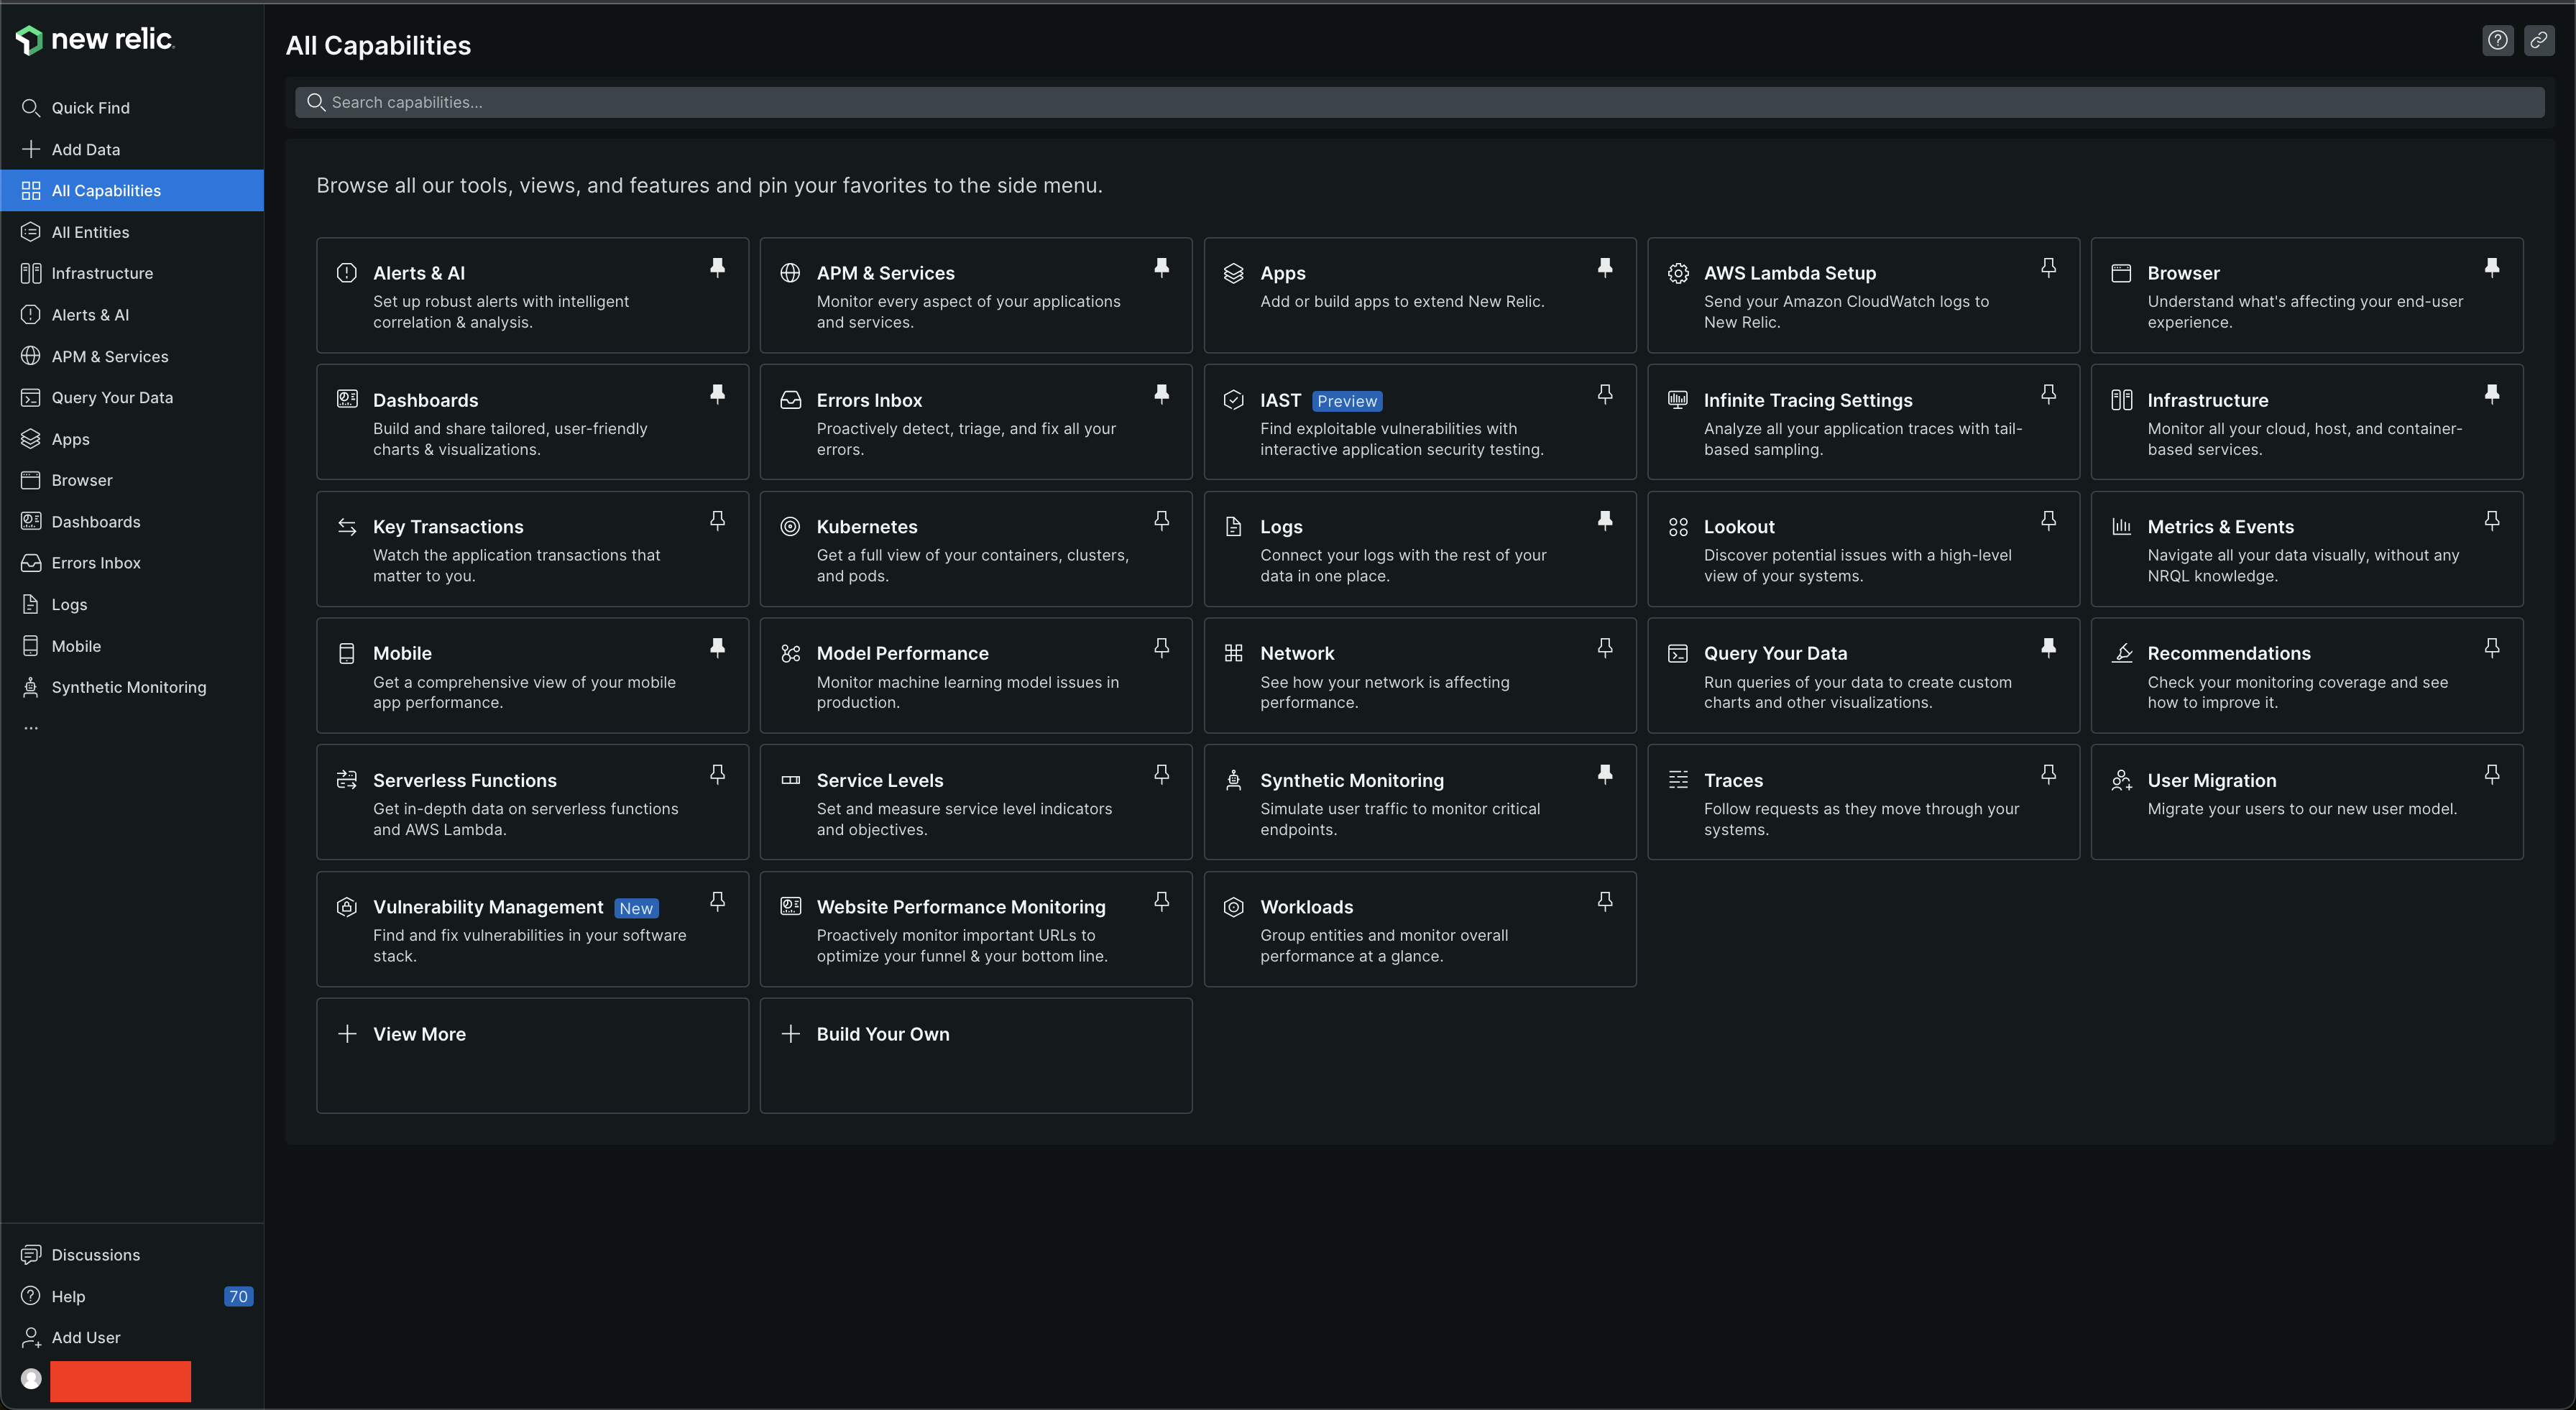
On the left navigation bar, you can find different sections. To find the whole set of sections/capabilities of New Relic, choose All Capabilities and search for what you are looking for
We have setup a few things in New Relic. For example, we have instrumented all the hosts (EC2 machines) that we have in each environment and are sending the data to New Relic. This data can be seen in visual form in Hosts section under All Entities section or you can find Hosts under Infrastructure section, which is the new place where Hosts section is going to go to
We have also setup Application Performance Monitoring (APM) for some of our services, which you can find under Services - APM section under All Entities section or APM & Services section in the left navigation bar. We use Open Telemetry to send in this data, so you can find this under Services - OpenTelemetry section in All Entities section or APM & Services section in the left navigation bar
On clicking the service, you can see different kinds of interesting data for some of our services, like response time, throughput (requests per minute), error rate (%) and more, like data about garbage collection
Till now we have seen only visualizations. To explore the data, you can go to the Query Your Data section and use Data Explorer to check visualizations for different event types - which can be New Relic events or Custom events. You can plot graphs based on different attributes of the events and also group them based on different dimensions. You can do this all visually. If you want to use code and get into the nitty gritty details and customize a lot, then you can use the Query builder section in Query You Data section. Here you can write New Relic Query Language (NRQL), which is kind of like Structured Query Language (SQL) and query your data, but has some specific New Relic related domain concepts and appropriate keywords
You can use NRQL to create charts, graphs and dashboards later. You can also use NRQL to create alerts. New Relic also helps you to create alerts through the Web Graphical User Interface (GUI) by asking a set of questions
The alerts section can be found under Alerts & AI section. We have setup Alert Conditions (policies) under the section with the same name under Alerts & AI section. For example, for staging, we have staging alerts policy that contains Alert conditions for different alerts - like high memory usage, high CPU usage and more. Along with Alert conditions, you can see Notification settings tab, which contains workflows that will be used to send the alerts to specific sets of destinations - in our case these are - Email and Slack. You can also find these workflows and destinations in separate sections with the same name under Alerts & AI section
That's all. That was a quick short overview of how to make sense of the New Relic platform. There's more, but this is some basic stuff we setup and look at in Togai