Trying out Prometheus Operator

I like learning new stuff - anything, including technology. I love tinkering with new tools, systems and services, especially open source projects
I recently tried out the latest version of Prometheus Operator while trying out installing Alertmanager with it and configuring Alertmanager with it, with all the custom resources that Prometheus Operator provides. I just wanted to write how easy and smooth it was to quickly get started! :D
Version Information of all software and source code used is available at the end of the post in the annexure section
Getting started with Prometheus Operator
Head to https://prometheus-operator.dev/
The latest version of Prometheus Operator as of this writing is v0.73.2
Click on Get started button, where you can see the docs
Head to the quick start then - https://prometheus-operator.dev/docs/prologue/quick-start/
I'm gonna be using a kind cluster, which is a Kubernetes Cluster inside a Docker container
Let's get kube-prometheus
$ git clone https://github.com/prometheus-operator/kube-prometheus.git
$ cd kube-prometheus
$ git show head --quiet --pretty=oneline
71e8adada95be82c66af8262fb935346ecf27caa (HEAD -> main, origin/main, origin/HEAD) Add blackbox-exporter to included components list (#2412)
That's the latest commit SHA 71e8adada95be82c66af8262fb935346ecf27caa we are using
Now,
Let's create the
kindclusterAnd then set the Kubernetes Config's Context to
kindCluster contextAnd then check if all is good by checking all the pods inside the cluster and see if it's all running
$ kind version
kind v0.21.0 go1.21.6 darwin/amd64

$ kind create cluster
Creating cluster "kind" ...
 ✓ Ensuring node image (kindest/node:v1.29.1) 🖼
 ✓ Preparing nodes 📦
 ✓ Writing configuration 📜
 ✓ Starting control-plane 🕹️
 ✓ Installing CNI 🔌
 ✓ Installing StorageClass 💾
Set kubectl context to "kind-kind"
You can now use your cluster with:

kubectl cluster-info --context kind-kind

Not sure what to do next? 😅  Check out https://kind.sigs.k8s.io/docs/user/quick-start/

$ kubectl config set-context kind-kind
Context "kind-kind" modified.

$ kubectl cluster-info
Kubernetes control plane is running at https://127.0.0.1:53364
CoreDNS is running at https://127.0.0.1:53364/api/v1/namespaces/kube-system/services/kube-dns:dns/proxy

To further debug and diagnose cluster problems, use 'kubectl cluster-info dump'.

$ kubectl get pods --all-namespaces
NAMESPACE            NAME                                         READY   STATUS    RESTARTS   AGE
kube-system          coredns-76f75df574-rpjvw                     1/1     Running   0          2m17s
kube-system          coredns-76f75df574-xdrjv                     1/1     Running   0          2m17s
kube-system          etcd-kind-control-plane                      1/1     Running   0          2m30s
kube-system          kindnet-g6pkl                                1/1     Running   0          2m17s
kube-system          kube-apiserver-kind-control-plane            1/1     Running   0          2m30s
kube-system          kube-controller-manager-kind-control-plane   1/1     Running   0          2m30s
kube-system          kube-proxy-nqgv5                             1/1     Running   0          2m17s
kube-system          kube-scheduler-kind-control-plane            1/1     Running   0          2m30s
local-path-storage   local-path-provisioner-7577fdbbfb-ghx2j      1/1     Running   0          2m17s
Now let's install kube-prometheus following the Prometheus Operator Docs
$ pwd
/Users/karuppiah.n/projects/github.com/prometheus-operator/kube-prometheus

$ # Create the namespace and CRDs, and then wait for them to be availble before creating the remaining resources
$ kubectl create -f manifests/setup
customresourcedefinition.apiextensions.k8s.io/alertmanagerconfigs.monitoring.coreos.com created
customresourcedefinition.apiextensions.k8s.io/alertmanagers.monitoring.coreos.com created
customresourcedefinition.apiextensions.k8s.io/podmonitors.monitoring.coreos.com created
customresourcedefinition.apiextensions.k8s.io/probes.monitoring.coreos.com created
customresourcedefinition.apiextensions.k8s.io/prometheuses.monitoring.coreos.com created
customresourcedefinition.apiextensions.k8s.io/prometheusagents.monitoring.coreos.com created
customresourcedefinition.apiextensions.k8s.io/prometheusrules.monitoring.coreos.com created
customresourcedefinition.apiextensions.k8s.io/scrapeconfigs.monitoring.coreos.com created
customresourcedefinition.apiextensions.k8s.io/servicemonitors.monitoring.coreos.com created
customresourcedefinition.apiextensions.k8s.io/thanosrulers.monitoring.coreos.com created
namespace/monitoring created

$ # Wait until the "servicemonitors" CRD is created. The message "No resources found" means success in this context.
$ until kubectl get servicemonitors --all-namespaces ; do date; sleep 1; echo ""; done
No resources found

$ kubectl create -f manifests/
alertmanager.monitoring.coreos.com/main created
networkpolicy.networking.k8s.io/alertmanager-main created
poddisruptionbudget.policy/alertmanager-main created
prometheusrule.monitoring.coreos.com/alertmanager-main-rules created
secret/alertmanager-main created
service/alertmanager-main created
serviceaccount/alertmanager-main created
servicemonitor.monitoring.coreos.com/alertmanager-main created
clusterrole.rbac.authorization.k8s.io/blackbox-exporter created
clusterrolebinding.rbac.authorization.k8s.io/blackbox-exporter created
configmap/blackbox-exporter-configuration created
deployment.apps/blackbox-exporter created
networkpolicy.networking.k8s.io/blackbox-exporter created
service/blackbox-exporter created
serviceaccount/blackbox-exporter created
servicemonitor.monitoring.coreos.com/blackbox-exporter created
secret/grafana-config created
secret/grafana-datasources created
configmap/grafana-dashboard-alertmanager-overview created
configmap/grafana-dashboard-apiserver created
configmap/grafana-dashboard-cluster-total created
configmap/grafana-dashboard-controller-manager created
configmap/grafana-dashboard-grafana-overview created
configmap/grafana-dashboard-k8s-resources-cluster created
configmap/grafana-dashboard-k8s-resources-multicluster created
configmap/grafana-dashboard-k8s-resources-namespace created
configmap/grafana-dashboard-k8s-resources-node created
configmap/grafana-dashboard-k8s-resources-pod created
configmap/grafana-dashboard-k8s-resources-workload created
configmap/grafana-dashboard-k8s-resources-workloads-namespace created
configmap/grafana-dashboard-kubelet created
configmap/grafana-dashboard-namespace-by-pod created
configmap/grafana-dashboard-namespace-by-workload created
configmap/grafana-dashboard-node-cluster-rsrc-use created
configmap/grafana-dashboard-node-rsrc-use created
configmap/grafana-dashboard-nodes-darwin created
configmap/grafana-dashboard-nodes created
configmap/grafana-dashboard-persistentvolumesusage created
configmap/grafana-dashboard-pod-total created
configmap/grafana-dashboard-prometheus-remote-write created
configmap/grafana-dashboard-prometheus created
configmap/grafana-dashboard-proxy created
configmap/grafana-dashboard-scheduler created
configmap/grafana-dashboard-workload-total created
configmap/grafana-dashboards created
deployment.apps/grafana created
networkpolicy.networking.k8s.io/grafana created
prometheusrule.monitoring.coreos.com/grafana-rules created
service/grafana created
serviceaccount/grafana created
servicemonitor.monitoring.coreos.com/grafana created
prometheusrule.monitoring.coreos.com/kube-prometheus-rules created
clusterrole.rbac.authorization.k8s.io/kube-state-metrics created
clusterrolebinding.rbac.authorization.k8s.io/kube-state-metrics created
deployment.apps/kube-state-metrics created
networkpolicy.networking.k8s.io/kube-state-metrics created
prometheusrule.monitoring.coreos.com/kube-state-metrics-rules created
service/kube-state-metrics created
serviceaccount/kube-state-metrics created
servicemonitor.monitoring.coreos.com/kube-state-metrics created
prometheusrule.monitoring.coreos.com/kubernetes-monitoring-rules created
servicemonitor.monitoring.coreos.com/kube-apiserver created
servicemonitor.monitoring.coreos.com/coredns created
servicemonitor.monitoring.coreos.com/kube-controller-manager created
servicemonitor.monitoring.coreos.com/kube-scheduler created
servicemonitor.monitoring.coreos.com/kubelet created
clusterrole.rbac.authorization.k8s.io/node-exporter created
clusterrolebinding.rbac.authorization.k8s.io/node-exporter created
daemonset.apps/node-exporter created
networkpolicy.networking.k8s.io/node-exporter created
prometheusrule.monitoring.coreos.com/node-exporter-rules created
service/node-exporter created
serviceaccount/node-exporter created
servicemonitor.monitoring.coreos.com/node-exporter created
clusterrole.rbac.authorization.k8s.io/prometheus-k8s created
clusterrolebinding.rbac.authorization.k8s.io/prometheus-k8s created
networkpolicy.networking.k8s.io/prometheus-k8s created
poddisruptionbudget.policy/prometheus-k8s created
prometheus.monitoring.coreos.com/k8s created
prometheusrule.monitoring.coreos.com/prometheus-k8s-prometheus-rules created
rolebinding.rbac.authorization.k8s.io/prometheus-k8s-config created
rolebinding.rbac.authorization.k8s.io/prometheus-k8s created
rolebinding.rbac.authorization.k8s.io/prometheus-k8s created
rolebinding.rbac.authorization.k8s.io/prometheus-k8s created
role.rbac.authorization.k8s.io/prometheus-k8s-config created
role.rbac.authorization.k8s.io/prometheus-k8s created
role.rbac.authorization.k8s.io/prometheus-k8s created
role.rbac.authorization.k8s.io/prometheus-k8s created
service/prometheus-k8s created
serviceaccount/prometheus-k8s created
servicemonitor.monitoring.coreos.com/prometheus-k8s created
apiservice.apiregistration.k8s.io/v1beta1.metrics.k8s.io created
clusterrole.rbac.authorization.k8s.io/prometheus-adapter created
clusterrole.rbac.authorization.k8s.io/system:aggregated-metrics-reader created
clusterrolebinding.rbac.authorization.k8s.io/prometheus-adapter created
clusterrolebinding.rbac.authorization.k8s.io/resource-metrics:system:auth-delegator created
clusterrole.rbac.authorization.k8s.io/resource-metrics-server-resources created
configmap/adapter-config created
deployment.apps/prometheus-adapter created
networkpolicy.networking.k8s.io/prometheus-adapter created
poddisruptionbudget.policy/prometheus-adapter created
rolebinding.rbac.authorization.k8s.io/resource-metrics-auth-reader created
service/prometheus-adapter created
serviceaccount/prometheus-adapter created
servicemonitor.monitoring.coreos.com/prometheus-adapter created
clusterrole.rbac.authorization.k8s.io/prometheus-operator created
clusterrolebinding.rbac.authorization.k8s.io/prometheus-operator created
deployment.apps/prometheus-operator created
networkpolicy.networking.k8s.io/prometheus-operator created
prometheusrule.monitoring.coreos.com/prometheus-operator-rules created
service/prometheus-operator created
serviceaccount/prometheus-operator created
servicemonitor.monitoring.coreos.com/prometheus-operator created
That's all, now you can access Prometheus once it's up and running. Let's look at all the pods once and then just the pods in monitoring namespace
$ kubectl get pods --all-namespaces
NAMESPACE            NAME                                         READY   STATUS              RESTARTS   AGE
kube-system          coredns-76f75df574-rpjvw                     1/1     Running             0          5m44s
kube-system          coredns-76f75df574-xdrjv                     1/1     Running             0          5m44s
kube-system          etcd-kind-control-plane                      1/1     Running             0          5m57s
kube-system          kindnet-g6pkl                                1/1     Running             0          5m44s
kube-system          kube-apiserver-kind-control-plane            1/1     Running             0          5m57s
kube-system          kube-controller-manager-kind-control-plane   1/1     Running             0          5m57s
kube-system          kube-proxy-nqgv5                             1/1     Running             0          5m44s
kube-system          kube-scheduler-kind-control-plane            1/1     Running             0          5m57s
local-path-storage   local-path-provisioner-7577fdbbfb-ghx2j      1/1     Running             0          5m44s
monitoring           blackbox-exporter-56fdc64996-545fb           0/3     ContainerCreating   0          58s
monitoring           grafana-79cc6f7f6b-6wjh2                     0/1     Running             0          56s
monitoring           kube-state-metrics-c847886f8-h9zz2           0/3     ContainerCreating   0          56s
monitoring           node-exporter-x5m8t                          0/2     ContainerCreating   0          55s
monitoring           prometheus-adapter-74894c5547-gvr76          0/1     ContainerCreating   0          55s
monitoring           prometheus-adapter-74894c5547-hfnqg          0/1     ContainerCreating   0          55s
monitoring           prometheus-operator-5b4bf4f944-57kx2         0/2     ContainerCreating   0          54s

$ kubectl get pods --namespace monitoring
NAME                                   READY   STATUS              RESTARTS   AGE
alertmanager-main-0                    0/2     Init:0/1            0          29s
alertmanager-main-1                    0/2     Init:0/1            0          29s
alertmanager-main-2                    0/2     Init:0/1            0          29s
blackbox-exporter-56fdc64996-545fb     0/3     ContainerCreating   0          99s
grafana-79cc6f7f6b-6wjh2               1/1     Running             0          97s
kube-state-metrics-c847886f8-h9zz2     3/3     Running             0          97s
node-exporter-x5m8t                    2/2     Running             0          96s
prometheus-adapter-74894c5547-gvr76    1/1     Running             0          96s
prometheus-adapter-74894c5547-hfnqg    1/1     Running             0          96s
prometheus-k8s-0                       0/2     Init:0/1            0          26s
prometheus-k8s-1                       0/2     Init:0/1            0          26s
prometheus-operator-5b4bf4f944-57kx2   2/2     Running             0          95s
Keep running kubectl get pods --namespace monitoring to check if all pods are up and running, or just use kubectl get pods --namespace monitoring --watch to watch the state of the pods change in real time
$ kubectl get pods --namespace monitoring --watch
NAME                                   READY   STATUS            RESTARTS   AGE
alertmanager-main-0                    0/2     PodInitializing   0          43s
alertmanager-main-1                    0/2     PodInitializing   0          43s
alertmanager-main-2                    0/2     PodInitializing   0          43s
blackbox-exporter-56fdc64996-545fb     3/3     Running           0          113s
grafana-79cc6f7f6b-6wjh2               1/1     Running           0          111s
kube-state-metrics-c847886f8-h9zz2     3/3     Running           0          111s
node-exporter-x5m8t                    2/2     Running           0          110s
prometheus-adapter-74894c5547-gvr76    1/1     Running           0          110s
prometheus-adapter-74894c5547-hfnqg    1/1     Running           0          110s
prometheus-k8s-0                       0/2     Init:0/1          0          40s
prometheus-k8s-1                       0/2     Init:0/1          0          40s
prometheus-operator-5b4bf4f944-57kx2   2/2     Running           0          109s
prometheus-k8s-0                       0/2     PodInitializing   0          41s
prometheus-k8s-1                       0/2     PodInitializing   0          43s
alertmanager-main-0                    1/2     Running           0          53s
alertmanager-main-0                    2/2     Running           0          53s
alertmanager-main-1                    1/2     Running           0          54s
alertmanager-main-2                    1/2     Running           0          54s
alertmanager-main-1                    2/2     Running           0          54s
alertmanager-main-2                    2/2     Running           0          55s
Later, once you see that no new 🆕 changes are happening to any of the pods, kill the commands and look at the snapshot of all the pods present in monitoring namespace
It should finally look like this -
$ kubectl get pods --namespace monitoring
NAME                                   READY   STATUS    RESTARTS   AGE
alertmanager-main-0                    2/2     Running   0          2m18s
alertmanager-main-1                    2/2     Running   0          2m18s
alertmanager-main-2                    2/2     Running   0          2m18s
blackbox-exporter-56fdc64996-545fb     3/3     Running   0          3m28s
grafana-79cc6f7f6b-6wjh2               1/1     Running   0          3m26s
kube-state-metrics-c847886f8-h9zz2     3/3     Running   0          3m26s
node-exporter-x5m8t                    2/2     Running   0          3m25s
prometheus-adapter-74894c5547-gvr76    1/1     Running   0          3m25s
prometheus-adapter-74894c5547-hfnqg    1/1     Running   0          3m25s
prometheus-k8s-0                       2/2     Running   0          2m15s
prometheus-k8s-1                       2/2     Running   0          2m15s
prometheus-operator-5b4bf4f944-57kx2   2/2     Running   0          3m24s
Finally, do this -
$ kubectl --namespace monitoring port-forward svc/prometheus-k8s 9090
Forwarding from 127.0.0.1:9090 -> 9090
Forwarding from [::1]:9090 -> 9090
This command will port forward / publish the port 9090 to the host port 9090, so that we can access the prometheus-k8s Kubernetes service. 9090 is the default port number of Prometheus
Go to http://localhost:9090/ and you will see something like this
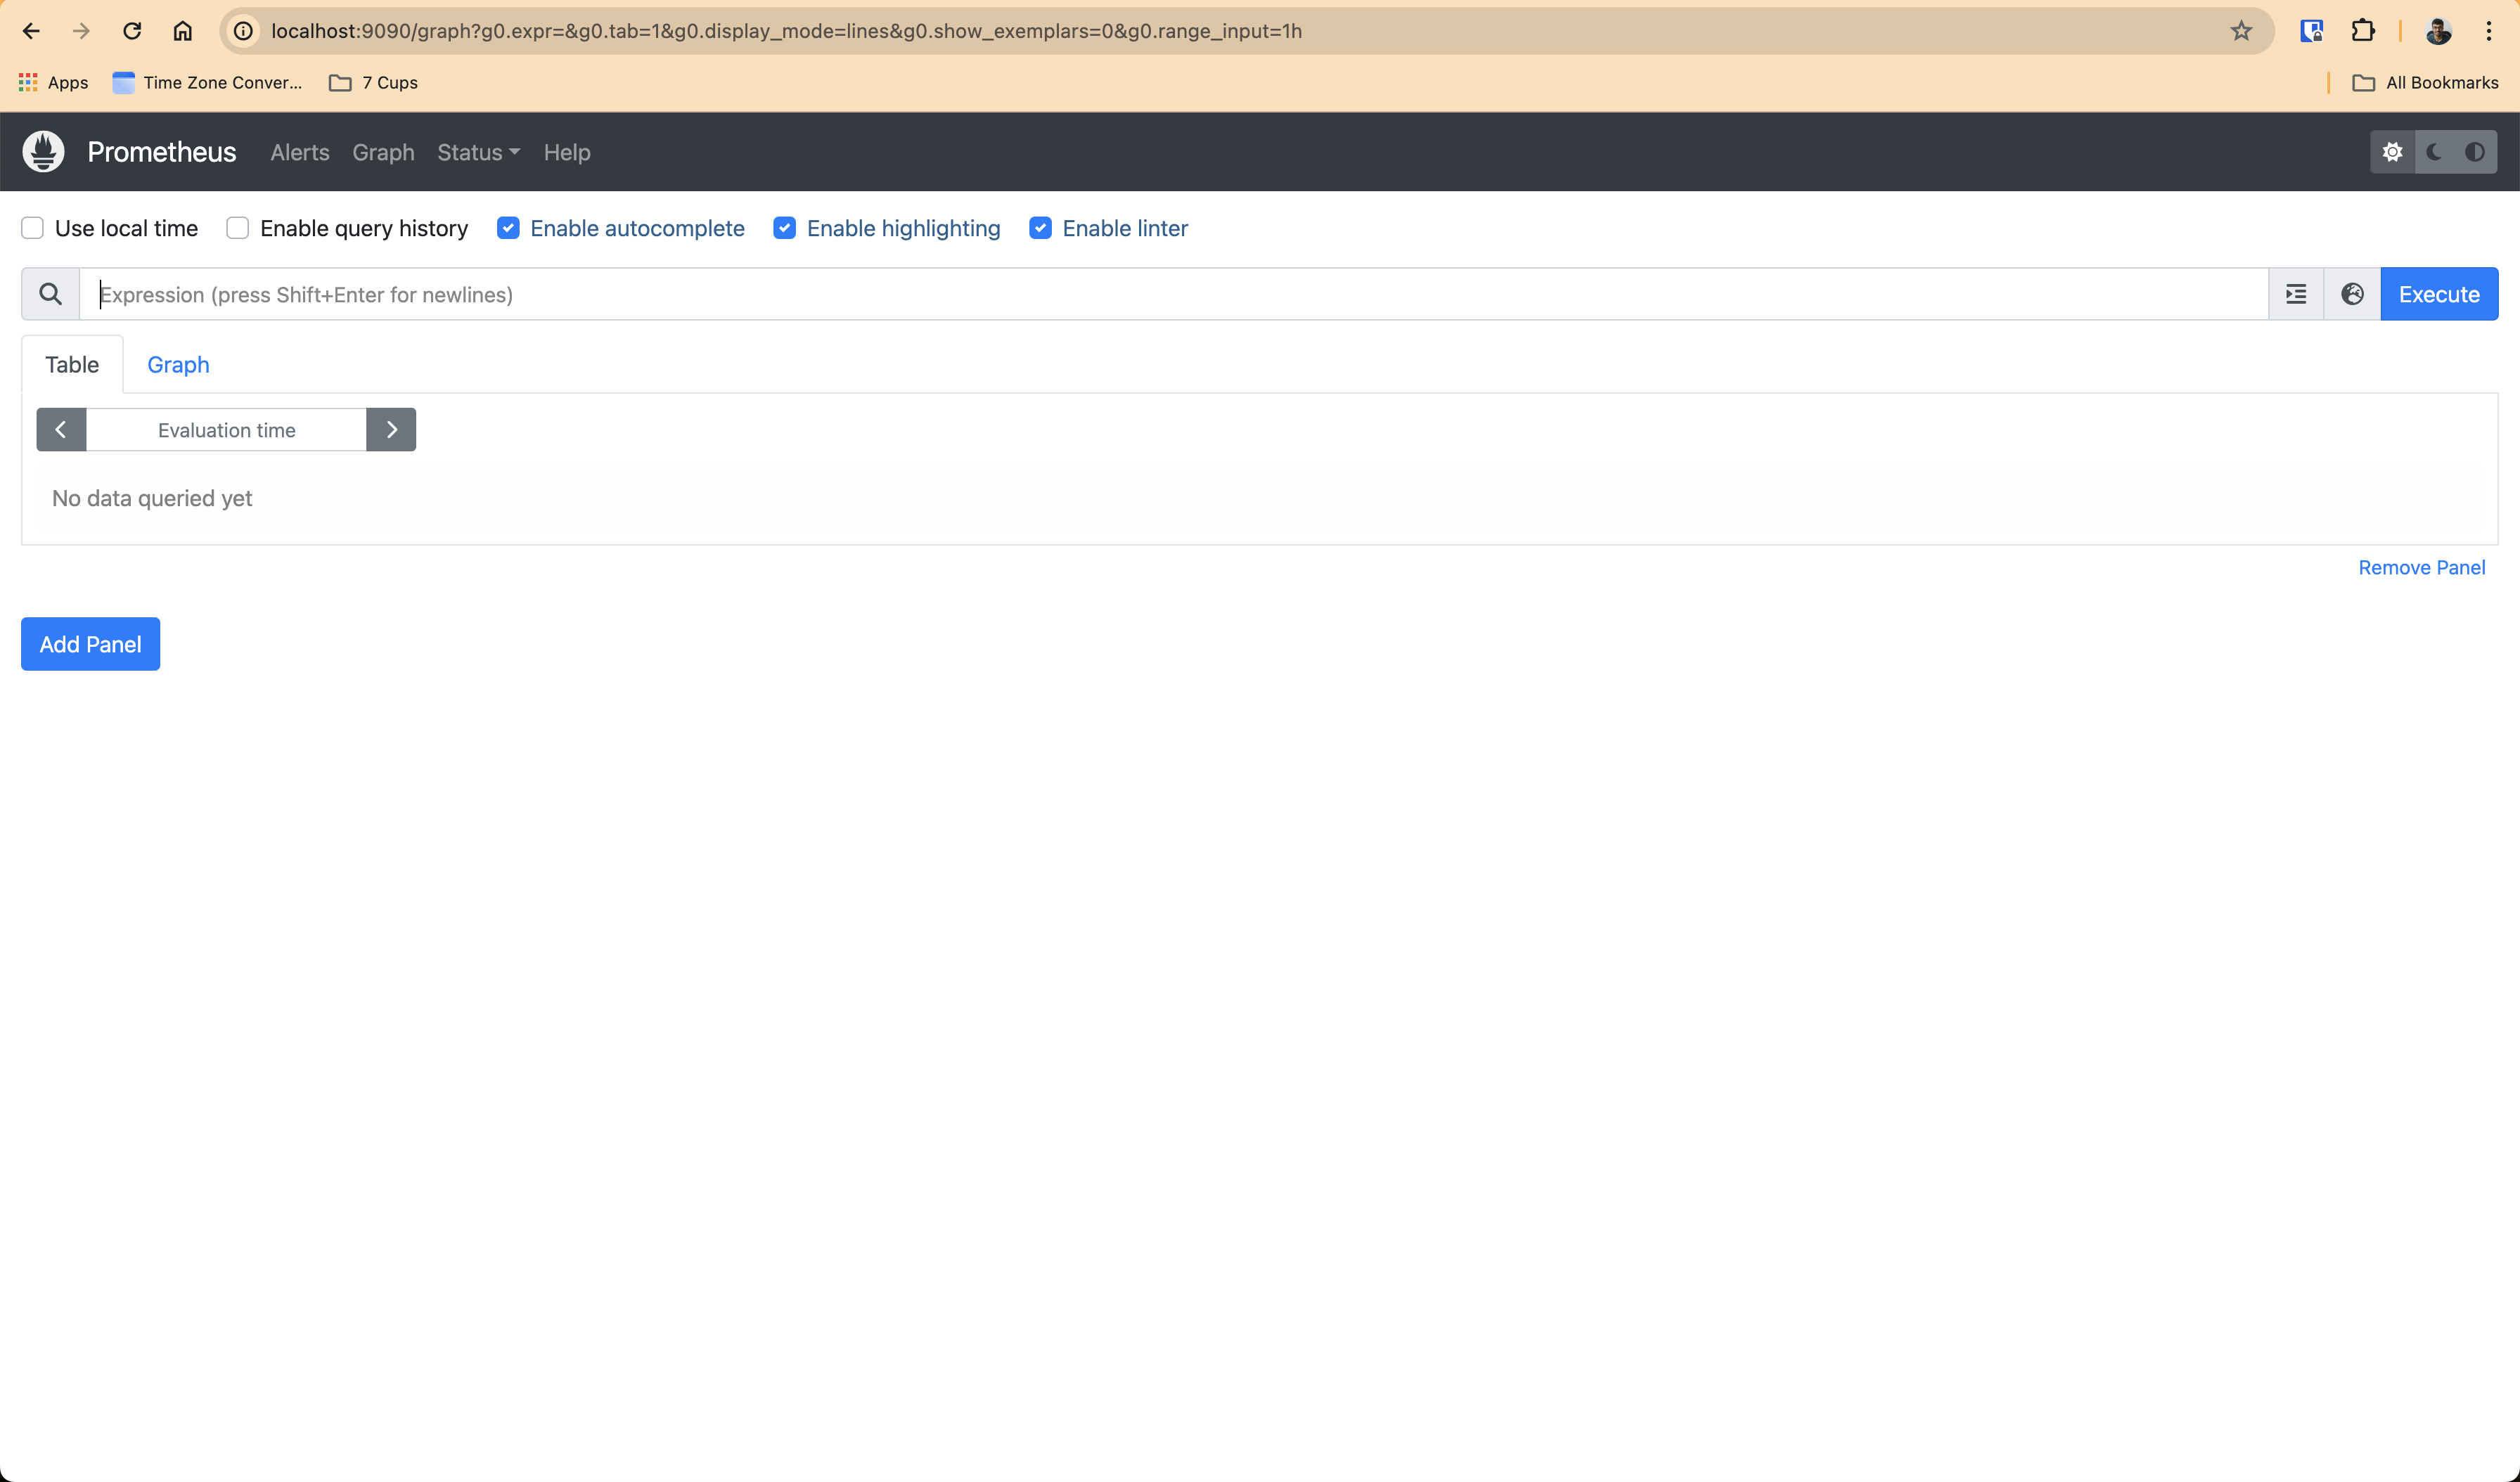
You can also see all the preconfigured Prometheus Rules - both Record Rules and Alert Rules, all over here - http://localhost:9090/rules and then targets at http://localhost:9090/targets and then alerts at http://localhost:9090/alerts 🔔 🚨 ‼️ and more, like Configuration at http://localhost:9090/config etc
And then you can access Alertmanager too like this -
$ kubectl --namespace monitoring port-forward svc/alertmanager-main 9093
Forwarding from 127.0.0.1:9093 -> 9093
Forwarding from [::1]:9093 -> 9093
Alertmanager will now be available at http://localhost:9093/
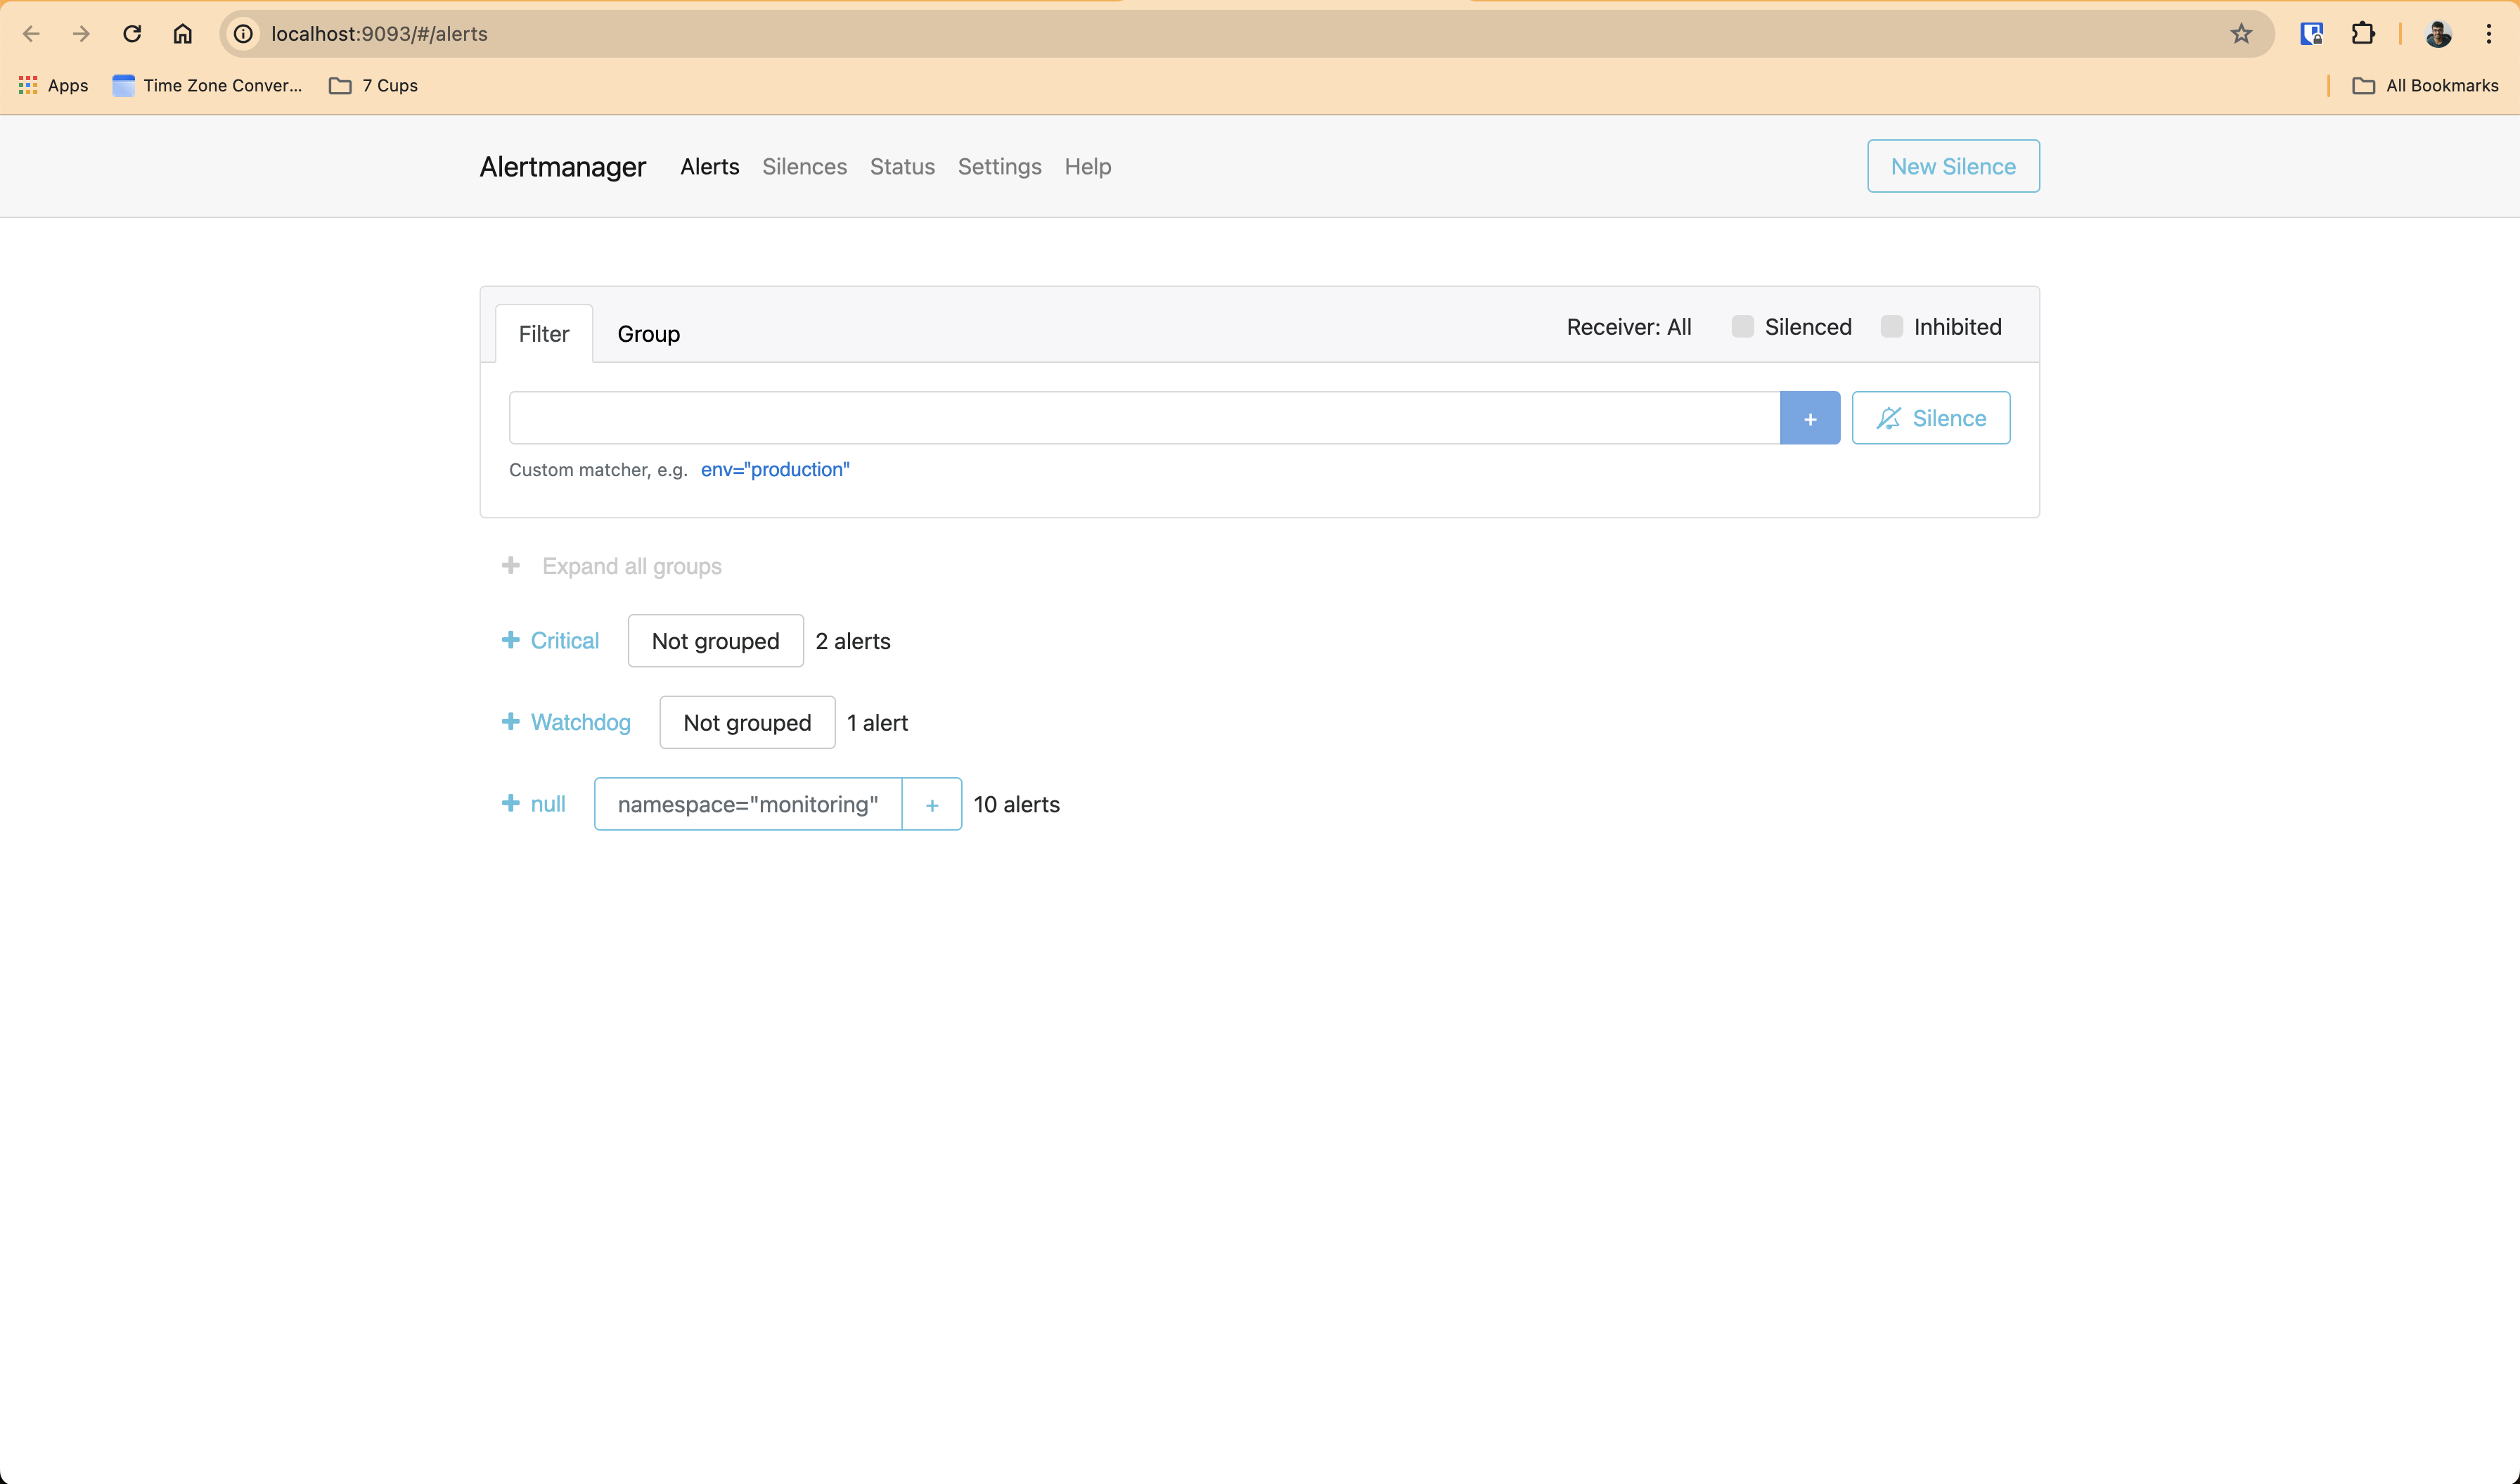
And then you can access Grafana too, like this -
$ kubectl --namespace monitoring port-forward svc/grafana 3000
Forwarding from 127.0.0.1:3000 -> 3000
Forwarding from [::1]:3000 -> 3000
Grafana will now be available at http://localhost:3000/
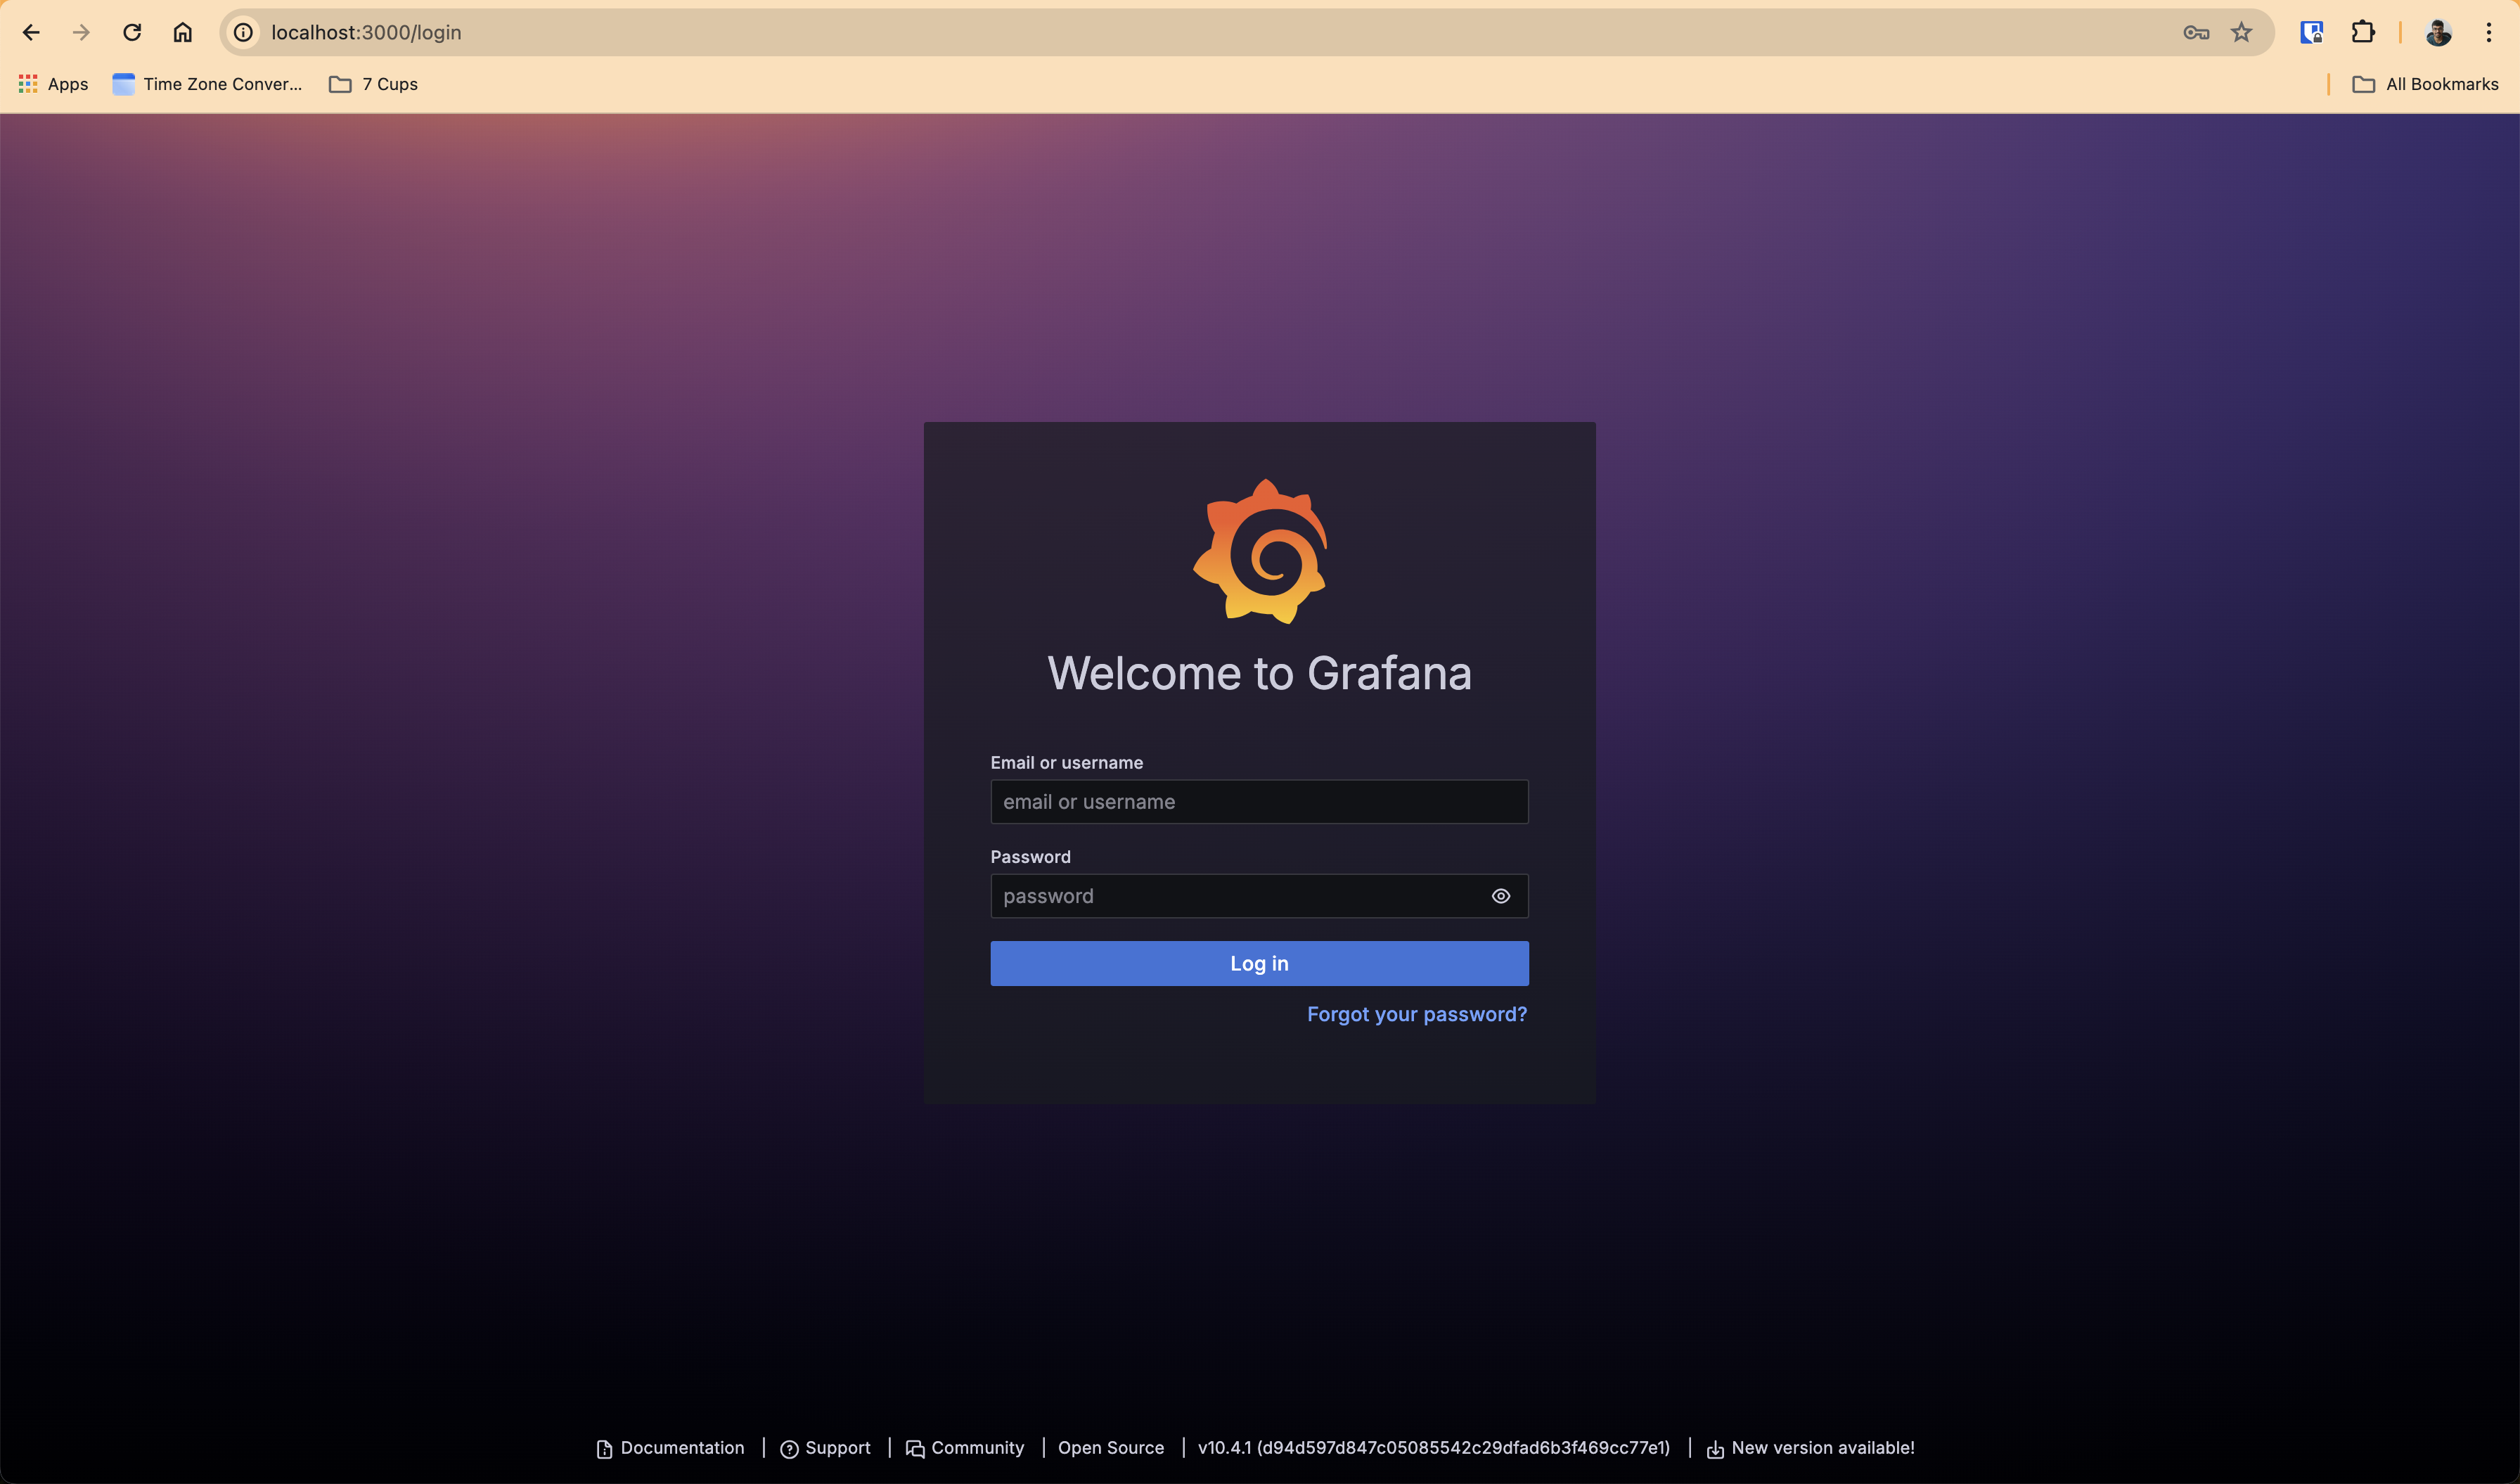
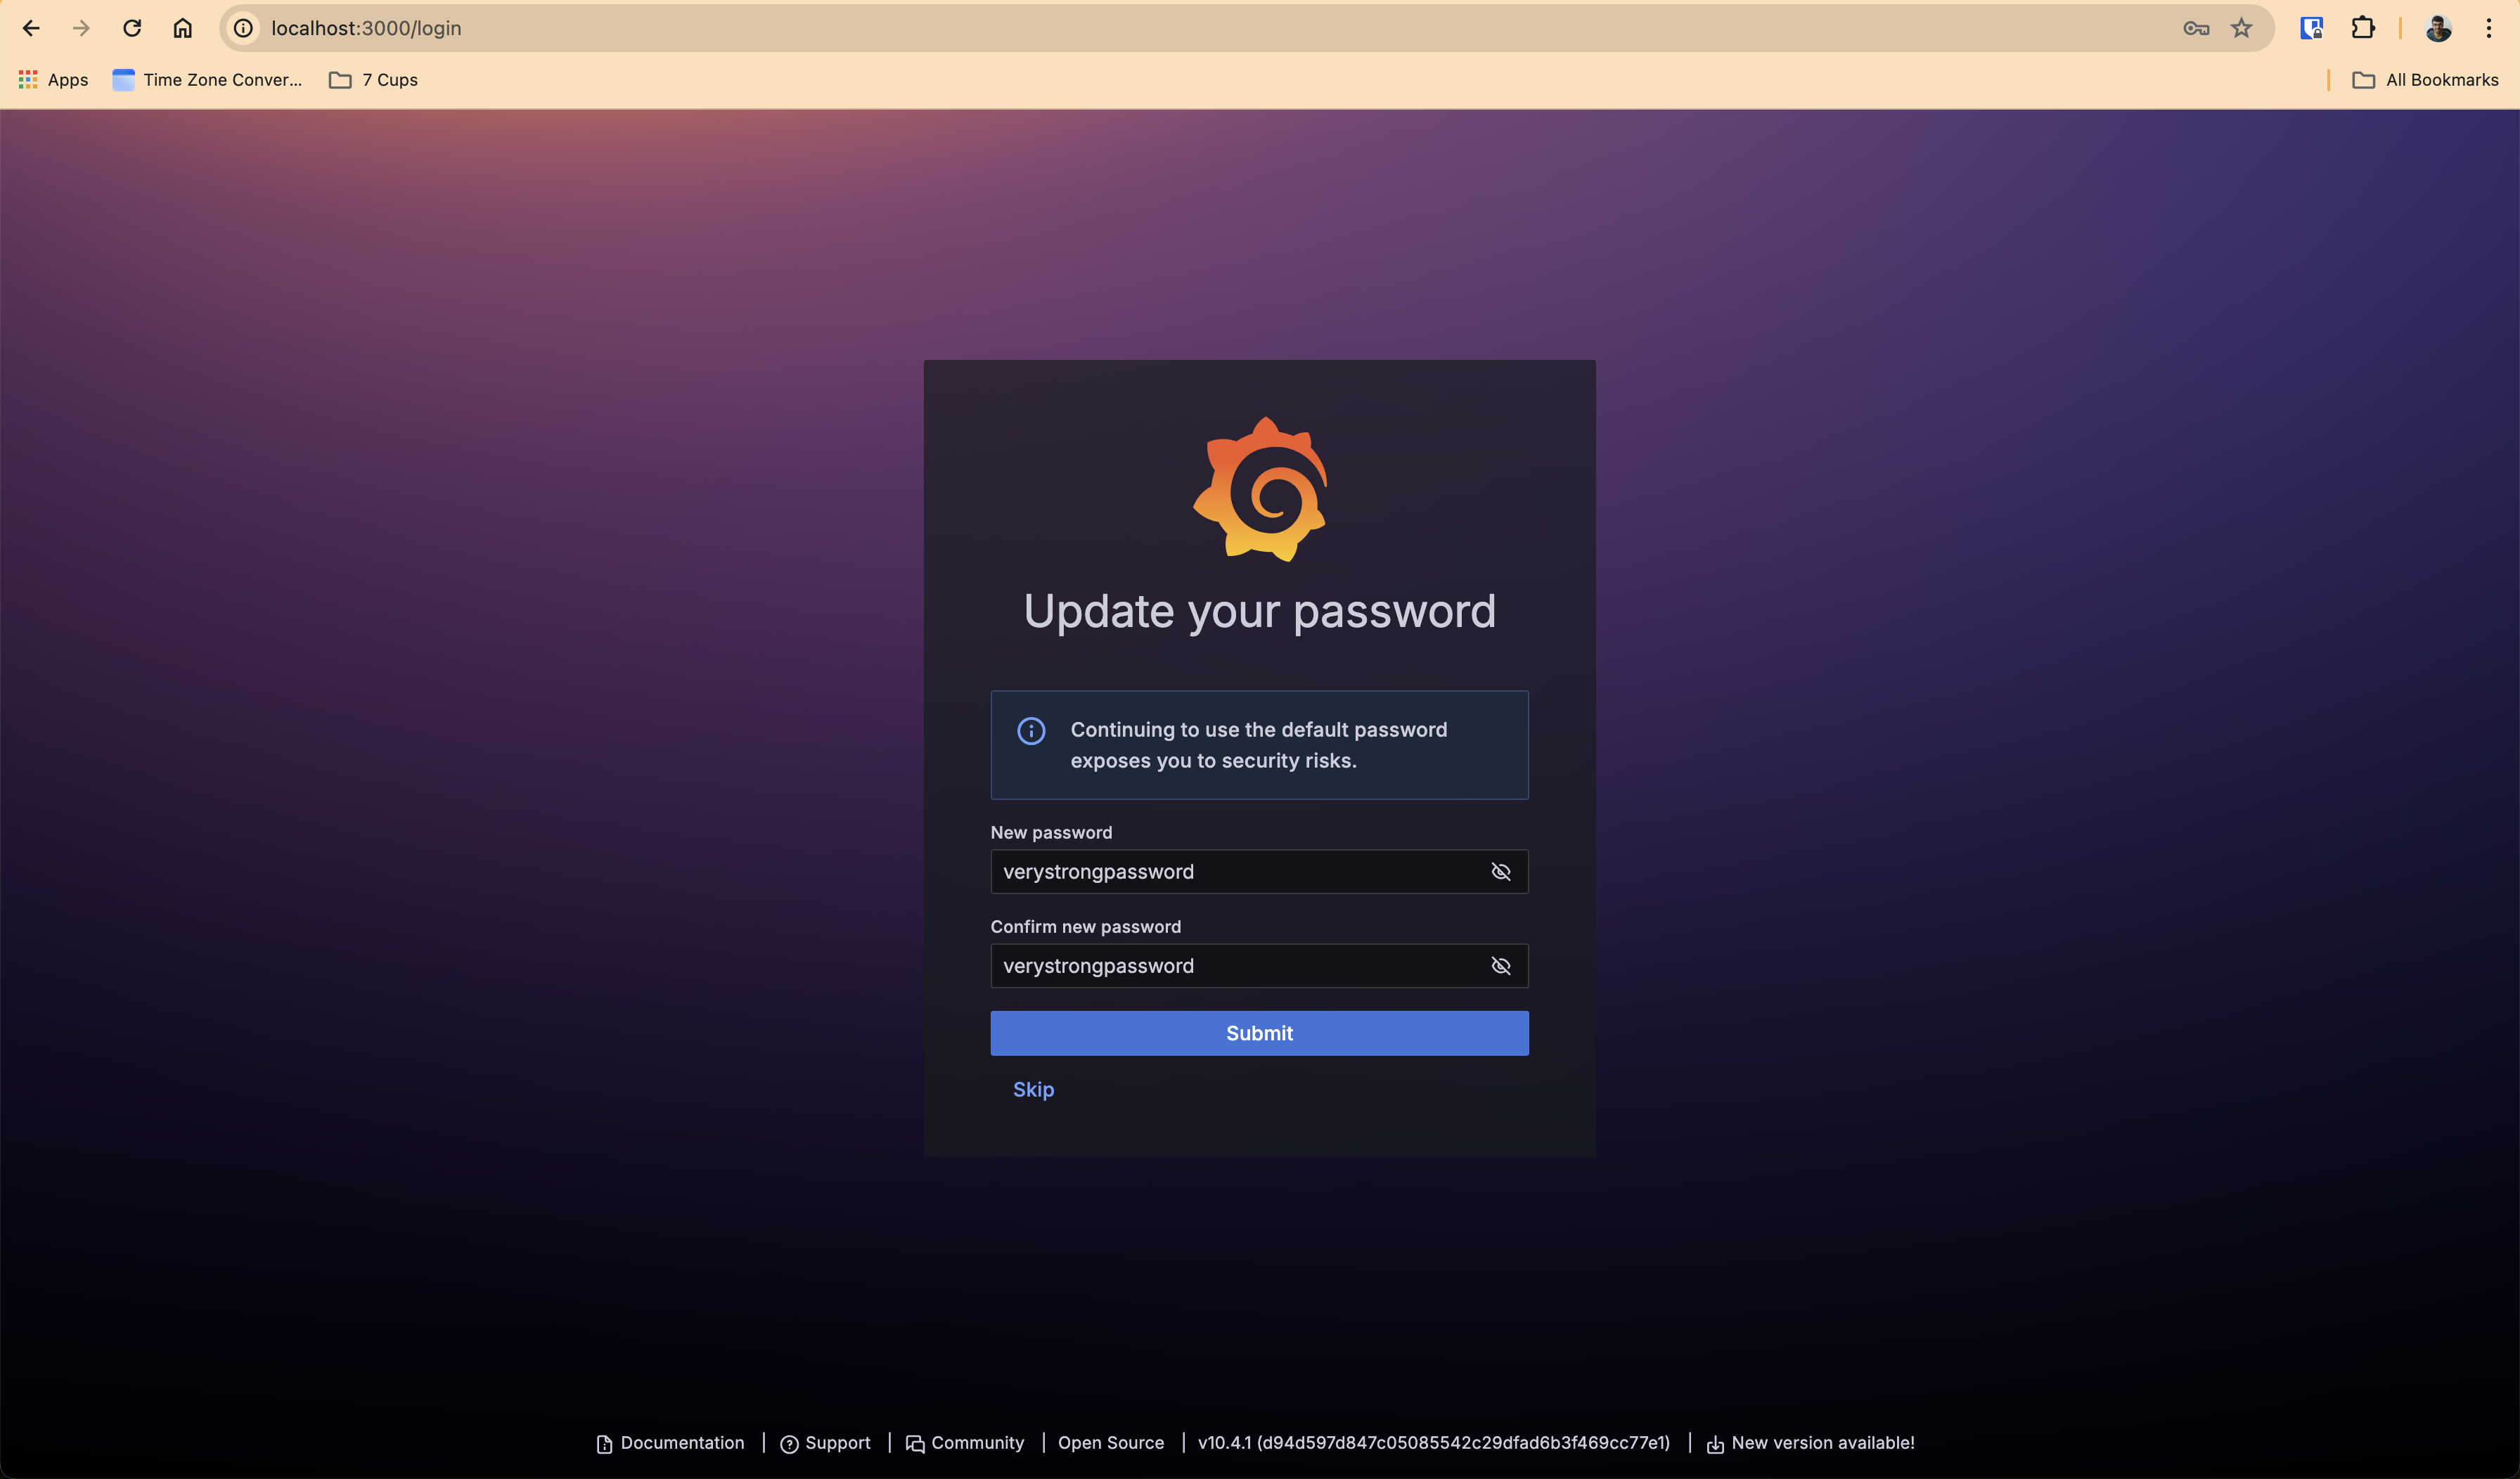
The default username and password at the time of this writing for the installed Grafana version (10.4.1) is admin and admin
Default Username: admin
Default Password: admin
Then you will be asked to change it immediately for security reasons. Feel free to change it or leave it, it's only a local development environment setup, so, it's fine. But for production environment and non local development environment, please do set it up :) And ensure it's all secure! :) :D
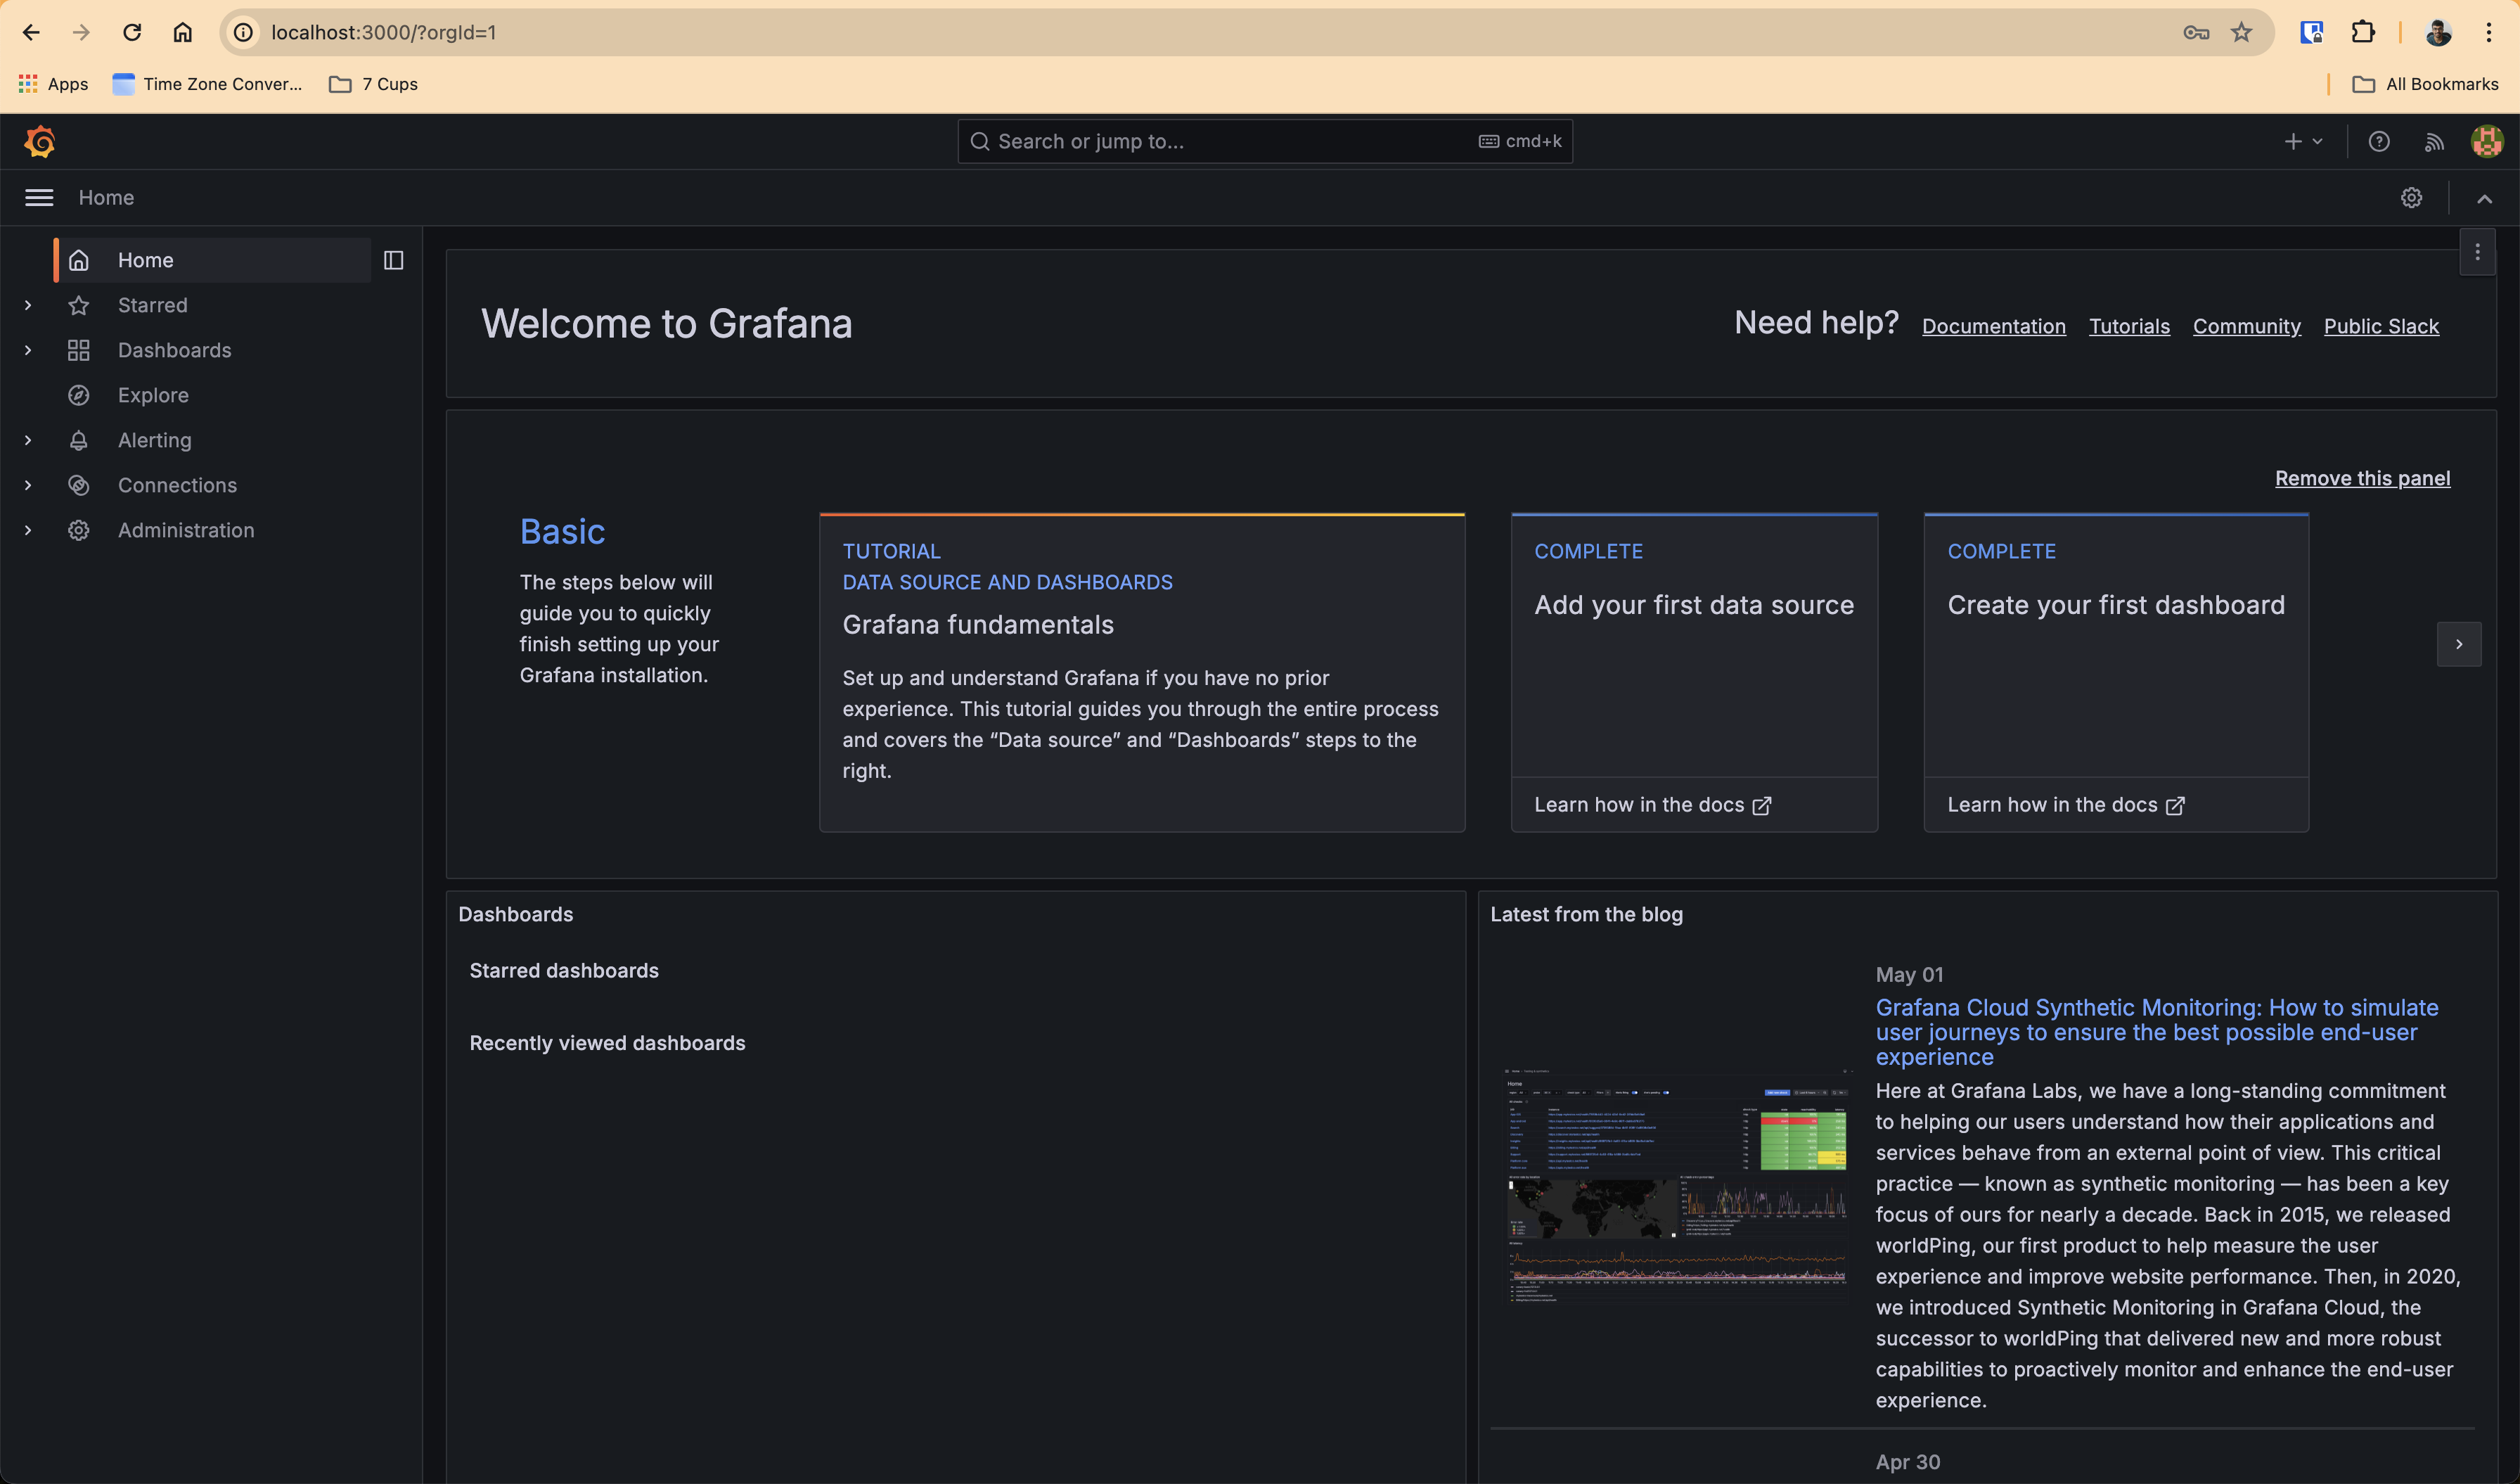
That's all! You are good to go :D
Once you are done and you want to cleanup everything, you can do that too, very easily. You can tear it all down as mentioned in the quick start like this -
$ pwd
/Users/karuppiah.n/projects/github.com/prometheus-operator/kube-prometheus

$ kubectl delete --ignore-not-found=true -f manifests/ -f manifests/setup
Annexure
Version Information of all software and source code used:
Prometheus Operator: v0.73.2
Prometheus: 2.51.2
Alertmanager: 0.27.0
Grafana: 10.4.1
kube-prometheus git repo - 71e8adada95be82c66af8262fb935346ecf27caa commit SHA
$ kind version
kind v0.21.0 go1.21.6 darwin/amd64

$ docker version
Client:
 Cloud integration: v1.0.35+desktop.5
 Version:           24.0.7
 API version:       1.43
 Go version:        go1.20.10
 Git commit:        afdd53b
 Built:             Thu Oct 26 09:04:20 2023
 OS/Arch:           darwin/amd64
 Context:           desktop-linux

Server: Docker Desktop 4.26.1 (131620)
 Engine:
  Version:          24.0.7
  API version:      1.43 (minimum version 1.12)
  Go version:       go1.20.10
  Git commit:       311b9ff
  Built:            Thu Oct 26 09:08:02 2023
  OS/Arch:          linux/amd64
  Experimental:     false
 containerd:
  Version:          1.6.25
  GitCommit:        d8f198a4ed8892c764191ef7b3b06d8a2eeb5c7f
 runc:
  Version:          1.1.10
  GitCommit:        v1.1.10-0-g18a0cb0
 docker-init:
  Version:          0.19.0
  GitCommit:        de40ad0
More docs references:
https://prometheus-operator.dev/docs/operator/ has all sections starting with design https://prometheus-operator.dev/docs/operator/design/ and more


