Debugging and fixing a memory leak in a Node.js service in Production
I like learning new stuff - anything, including technology. I love tinkering with new tools, systems and services, especially open source projects
Too Long Didn't Read (TLDR;)
I used Service Down Slack alerts to find out that there was some issue with the service. I used the New Relic % Memory Usage Graph to notice that there's an unusual memory usage pattern. A colleague mentioned there might be a memory issue, like a memory leak issue. I used Clinic.js tools like Clinic.js Doctor and Clinic.js HeapProfiler and found out that there was a memory leak issue. Fixed the code causing the memory leak issue and deployed it and saw that there were no Service Down Slack alerts and the memory usage graph showed normal and constant memory usage
Tell me everything!
So, let me start from the first, from how I noticed the issue and the journey of debugging and fixing it.
The first incident happened on April 29th, 2023 around 8 AM IST (Indian Standard Time). The name of the service is Ingestion service, as you can see in the Slack alert. It's one of the major services in Togai. It's the service that exposes two very important endpoints to all our customers which they use to ingest event data. It's the first point of interaction and/or integration for any customer using Togai APIs. This should make it clear as to how important the issue was. As the Ingestion service going down would highly impact our customers and was very much of a concern to us
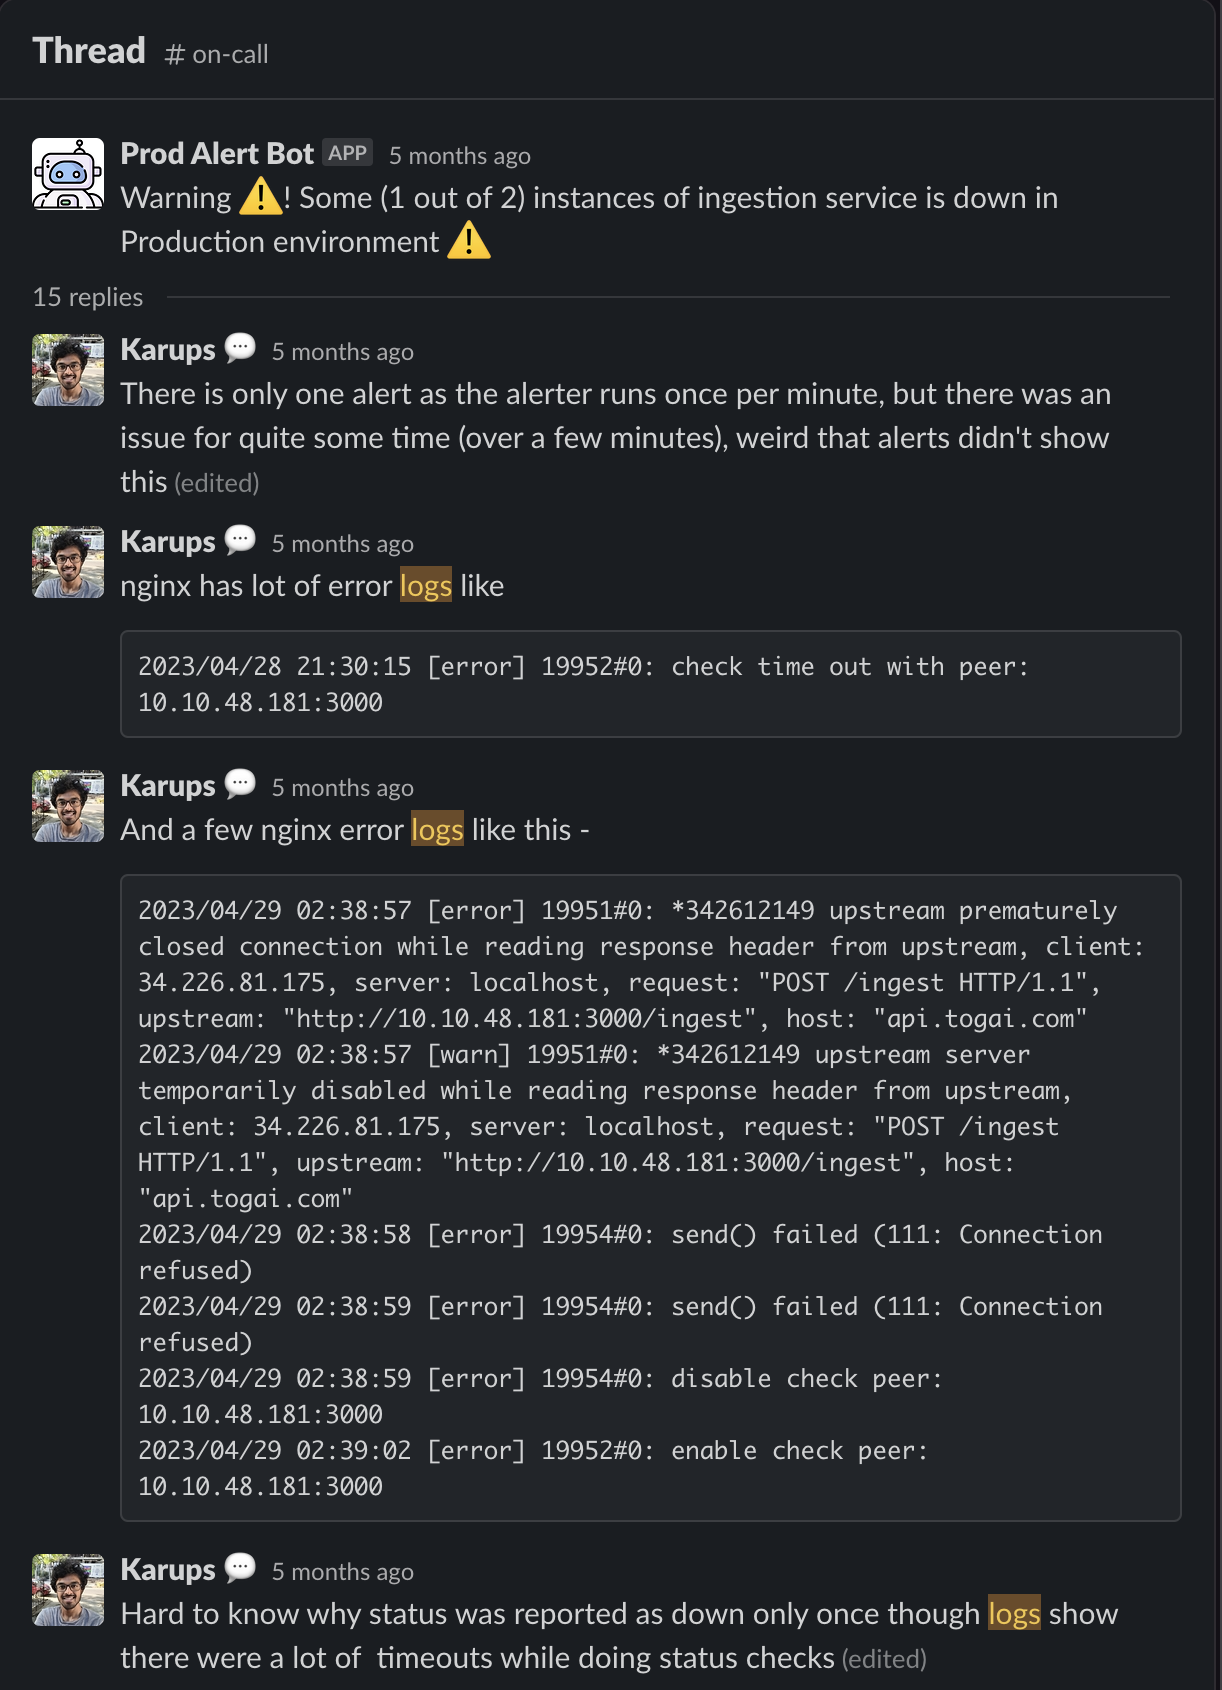
We couldn't find the root cause of it at the time. Looking at the New Relic dashboard now for that timeline, there's no data. I think we didn't even have New Relic monitoring setup at the time, either that or New Relic got rid of some old data based on their data retention policies. I can see New Relic data from May 4th, 2023 though.
At the time our monitoring and observability at Togai was still pretty nascent. It still is in some cases, to some extent. For example, nowhere we log and capture why a service was marked as down - what was the response of its status endpoint - was it no response with a connection refused error? Was it a 400 Bad Request? Was it a 500 Internal Server error? Was it a timeout error? Our nginx does status checks for all the upstreams and then routes traffic to the appropriate instances of the upstream based on the status checks - that is - only route requests when the upstream instance is up and running, which would mean a 200 OK ✅ response when hitting the service's status endpoint. As you can see above, our nginx does log information about the connection refused error, so that's good, but when the response does come and is not a 200 OK response, we don't capture what the response body was - which would help us in understanding more details. For example, our services show that the status was unhealthy because of some issue in the database when - say database connectivity is not healthy, which is conveyed in the status endpoint response as DatabaseHealthCheck; for example, it looks like this -
[
    {
        "name": "DatabaseHealthCheck",
        "healthy": true,
        "lastCheck": "2023-09-22T06:55:09.641398Z",
        "message": "Connected to database successfully",
        "cause": null,
        "consecutiveSuccesses": 13046,
        "consecutiveFailures": 0
    },
    {
        "name": "ThreadDeadlockHealthCheck",
        "healthy": true,
        "lastCheck": "2023-09-22T06:55:02.697439Z",
        "message": "There are 0 deadlocked threads",
        "cause": null,
        "consecutiveSuccesses": 13046,
        "consecutiveFailures": 0
    },
    {
        "name": "HikariPendingThreadsHealthCheck",
        "healthy": true,
        "lastCheck": "2023-09-22T06:55:02.697533Z",
        "message": "Threads awaiting database connection is equal or above threshold [0 <= 100]",
        "cause": null,
        "consecutiveSuccesses": 13046,
        "consecutiveFailures": 0
    }
]
And healthy field tells if the health is good or not
Anyways, with all these alerts 🚨 🔔 ‼️, KV, Karthick Vinod, a colleague of mine started helping me debug the issue. He found some interesting insights that I didn't even think of
I noticed that there were a lot of timeout errors in the nginx logs for the status checks. This means the service was taking a lot of time to respond to the status request and it timed out
I was wondering if it's high traffic leading to high response time or something like that
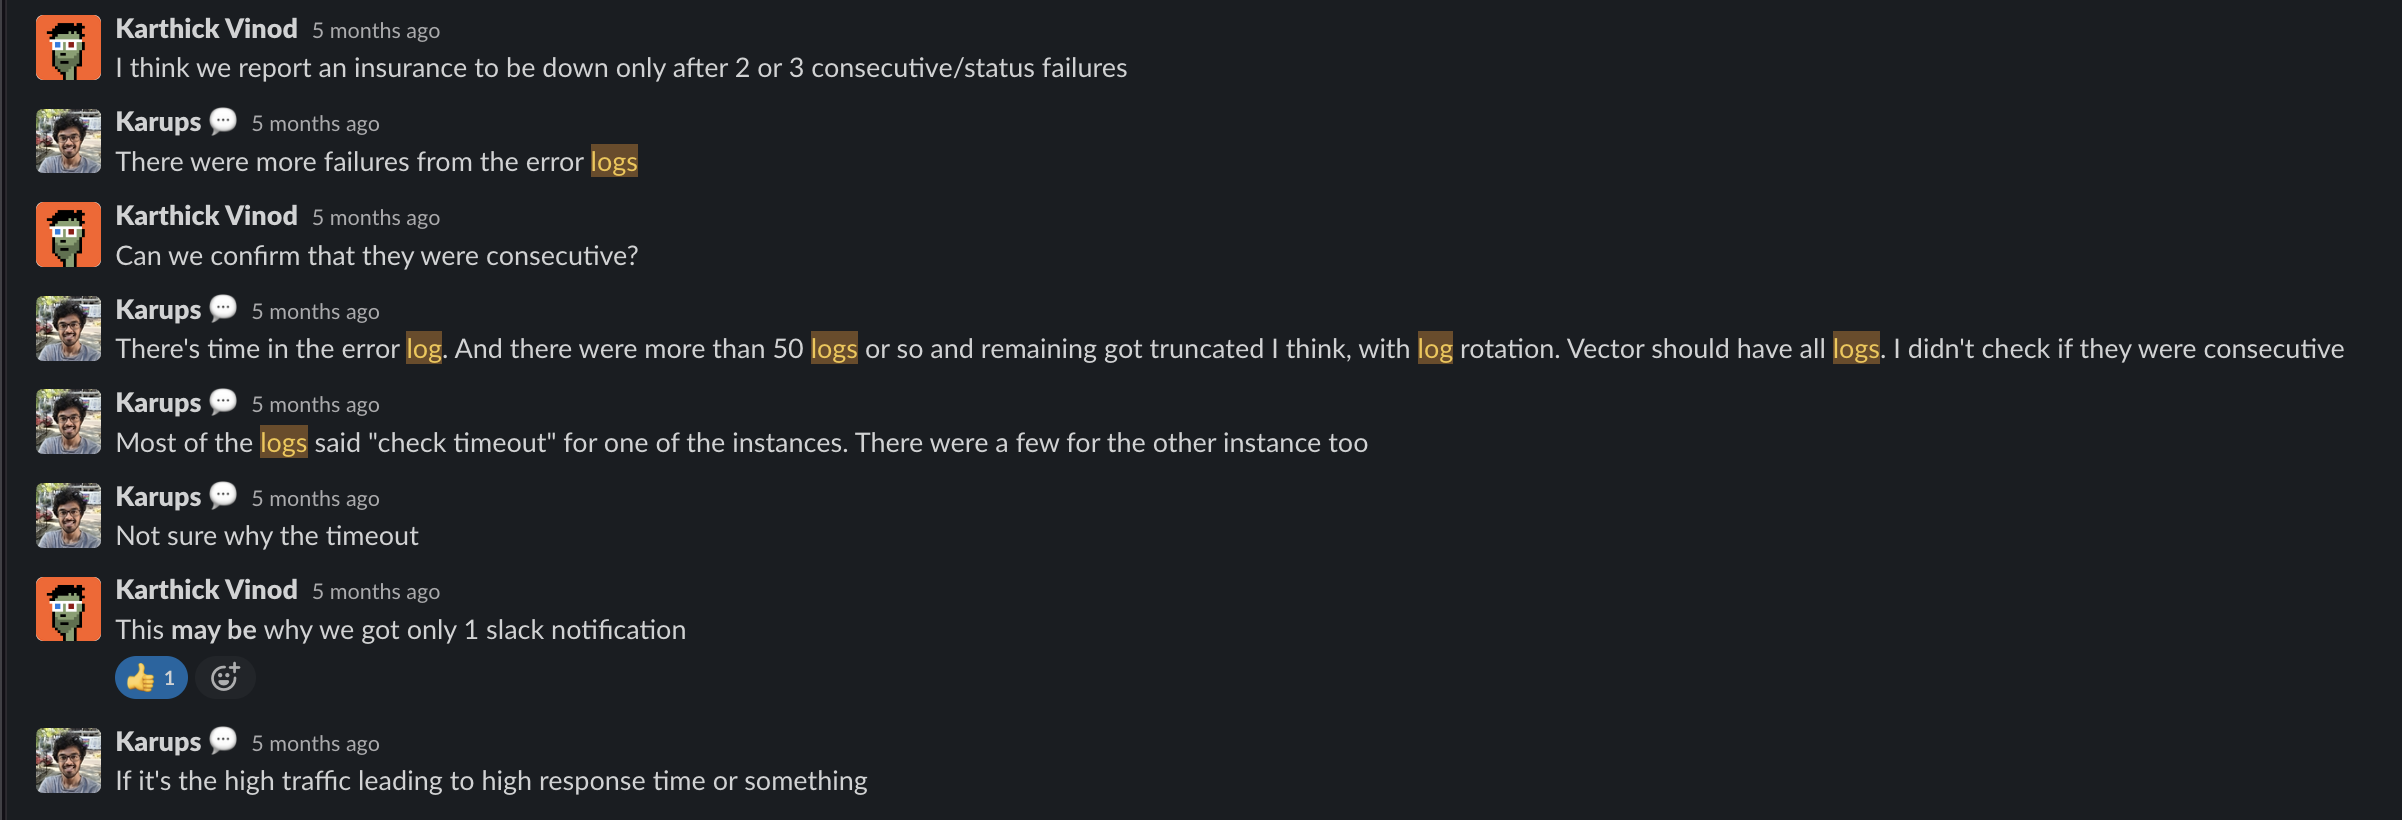
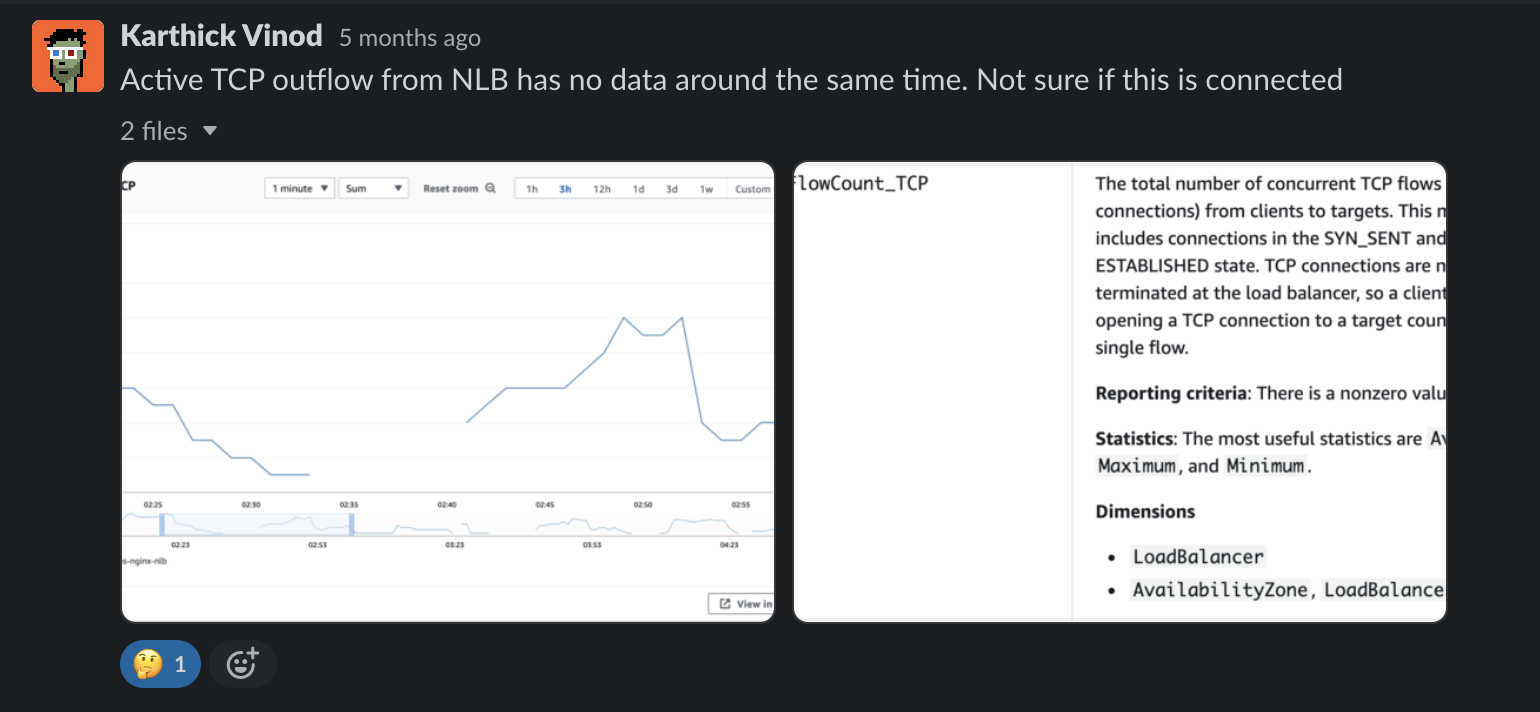
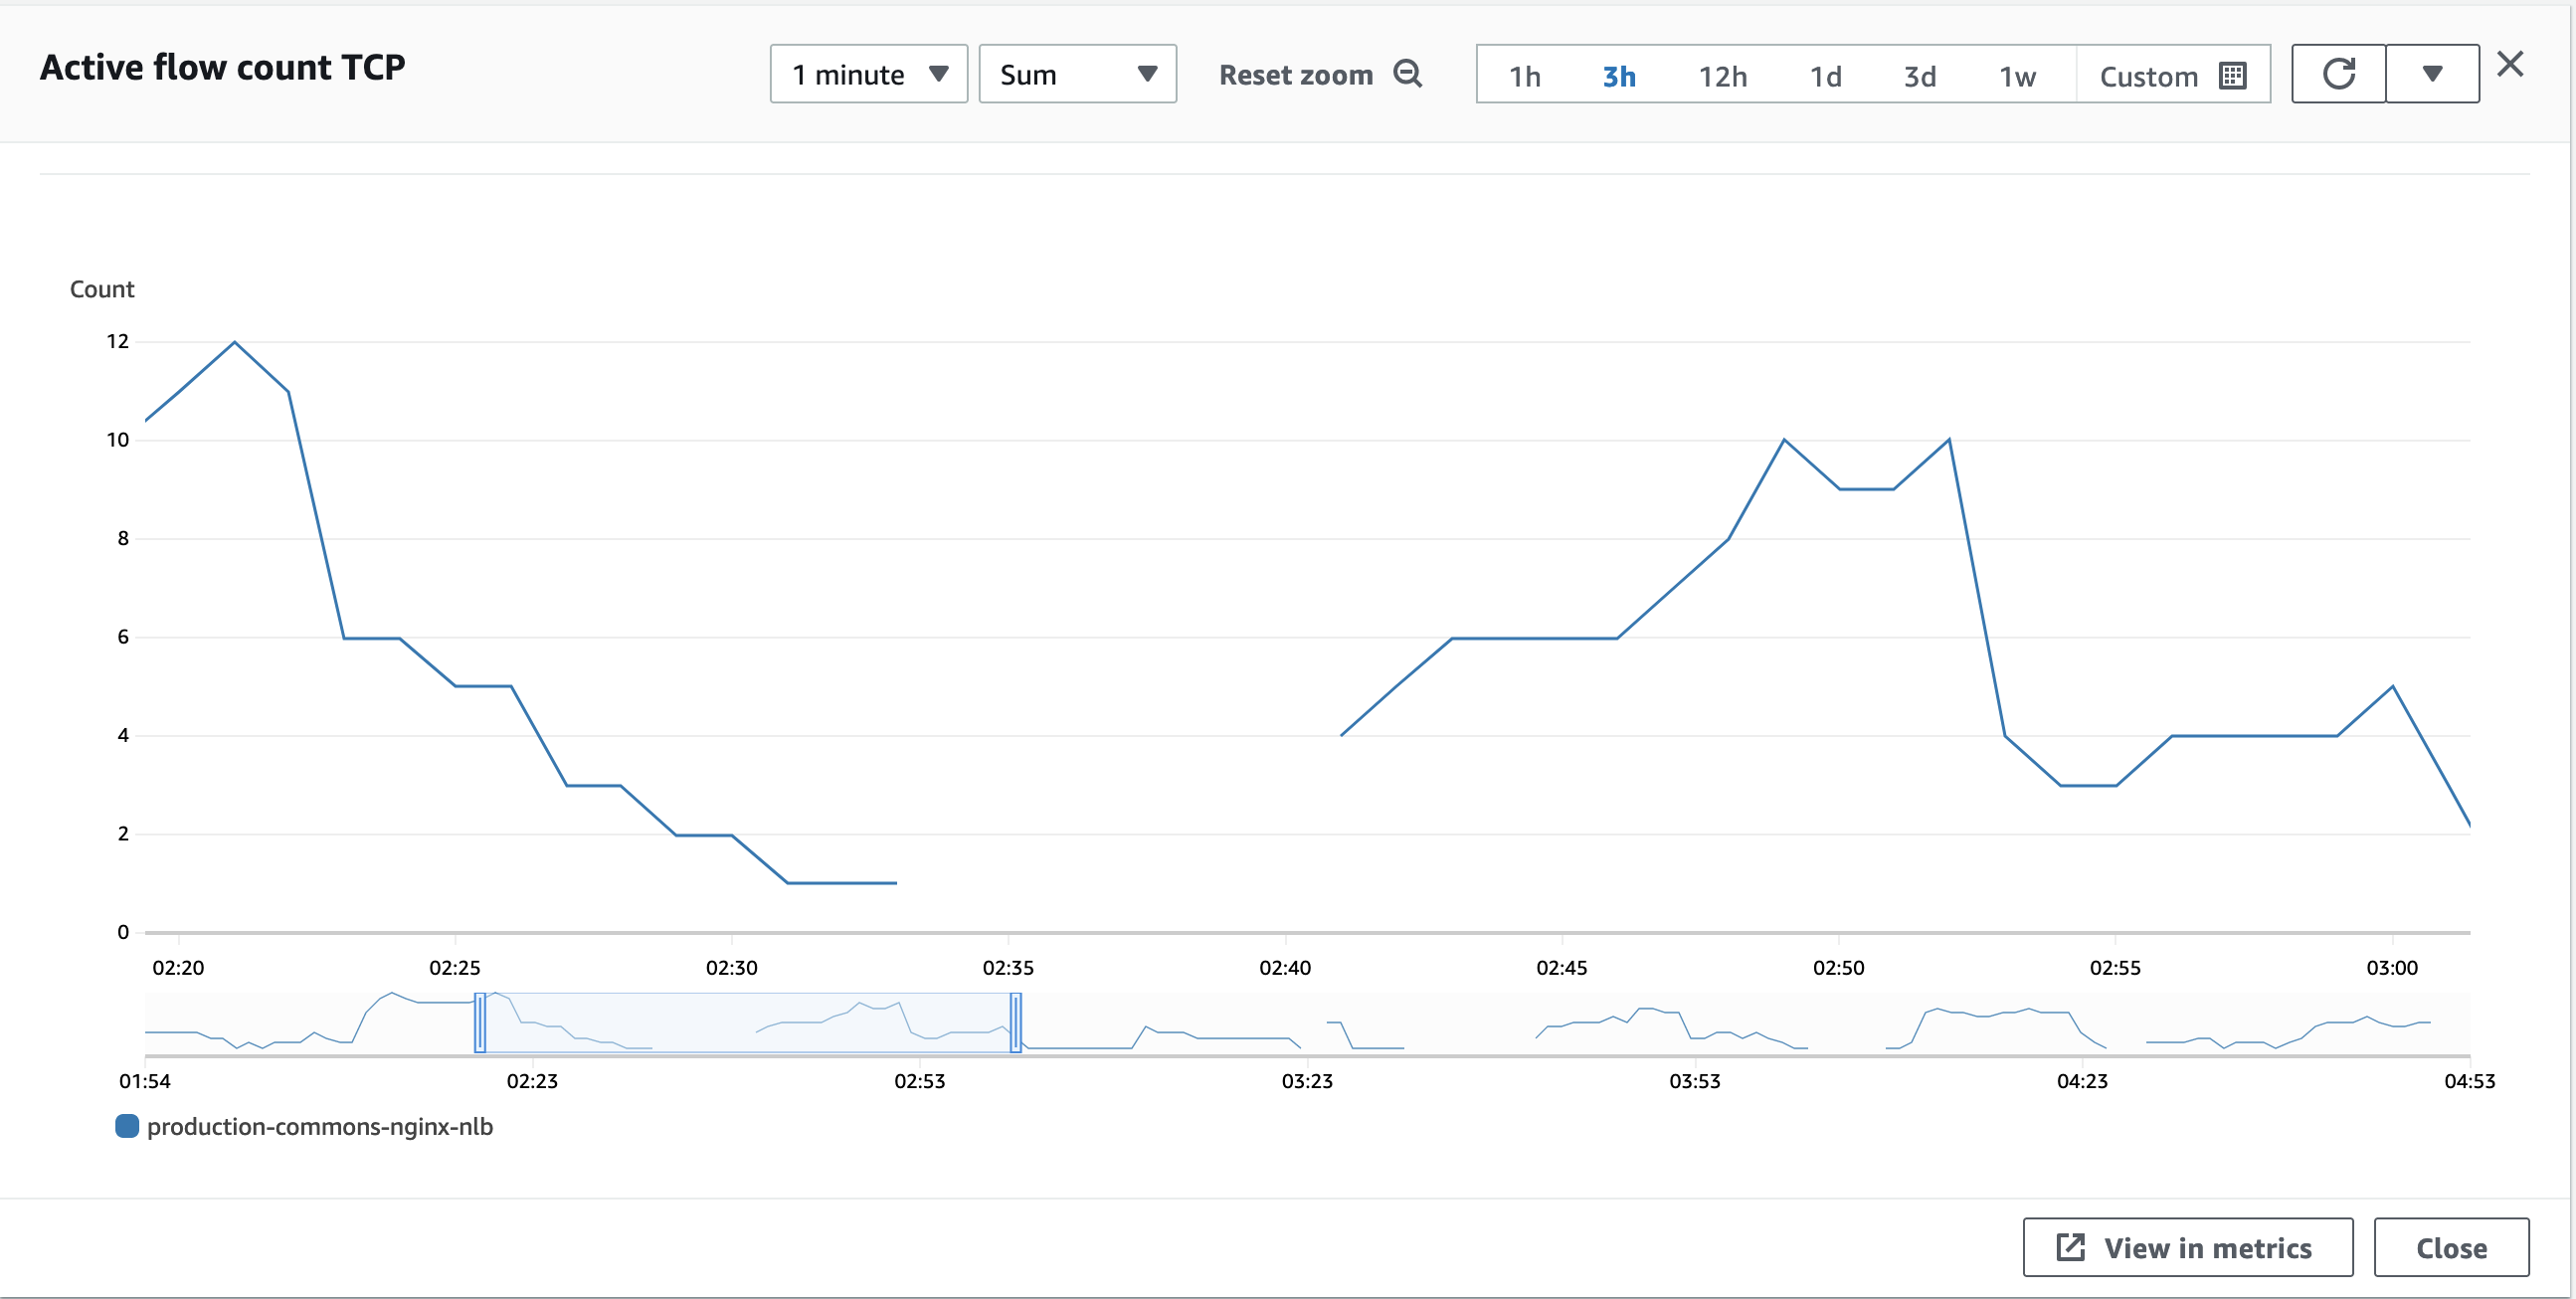
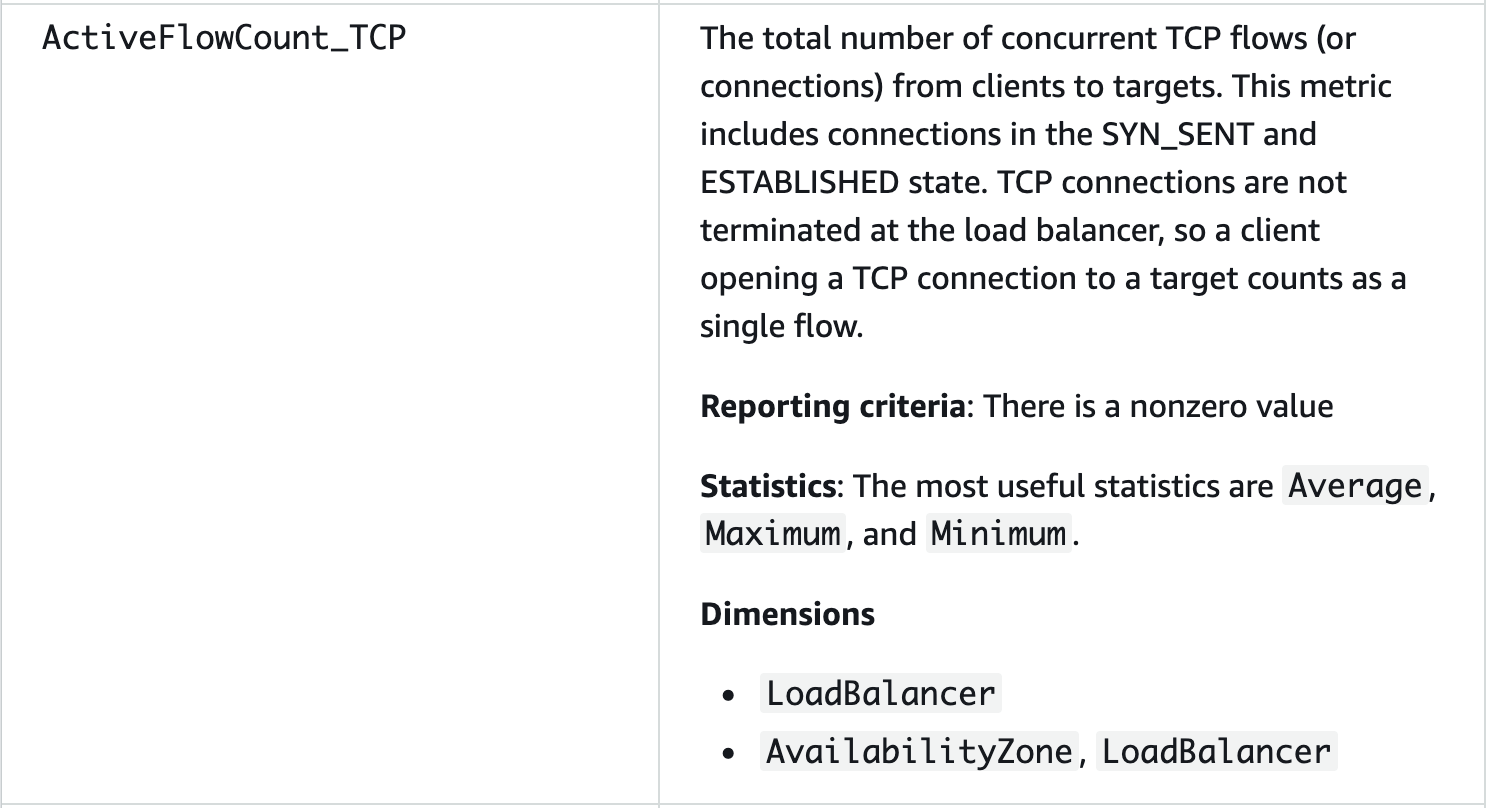

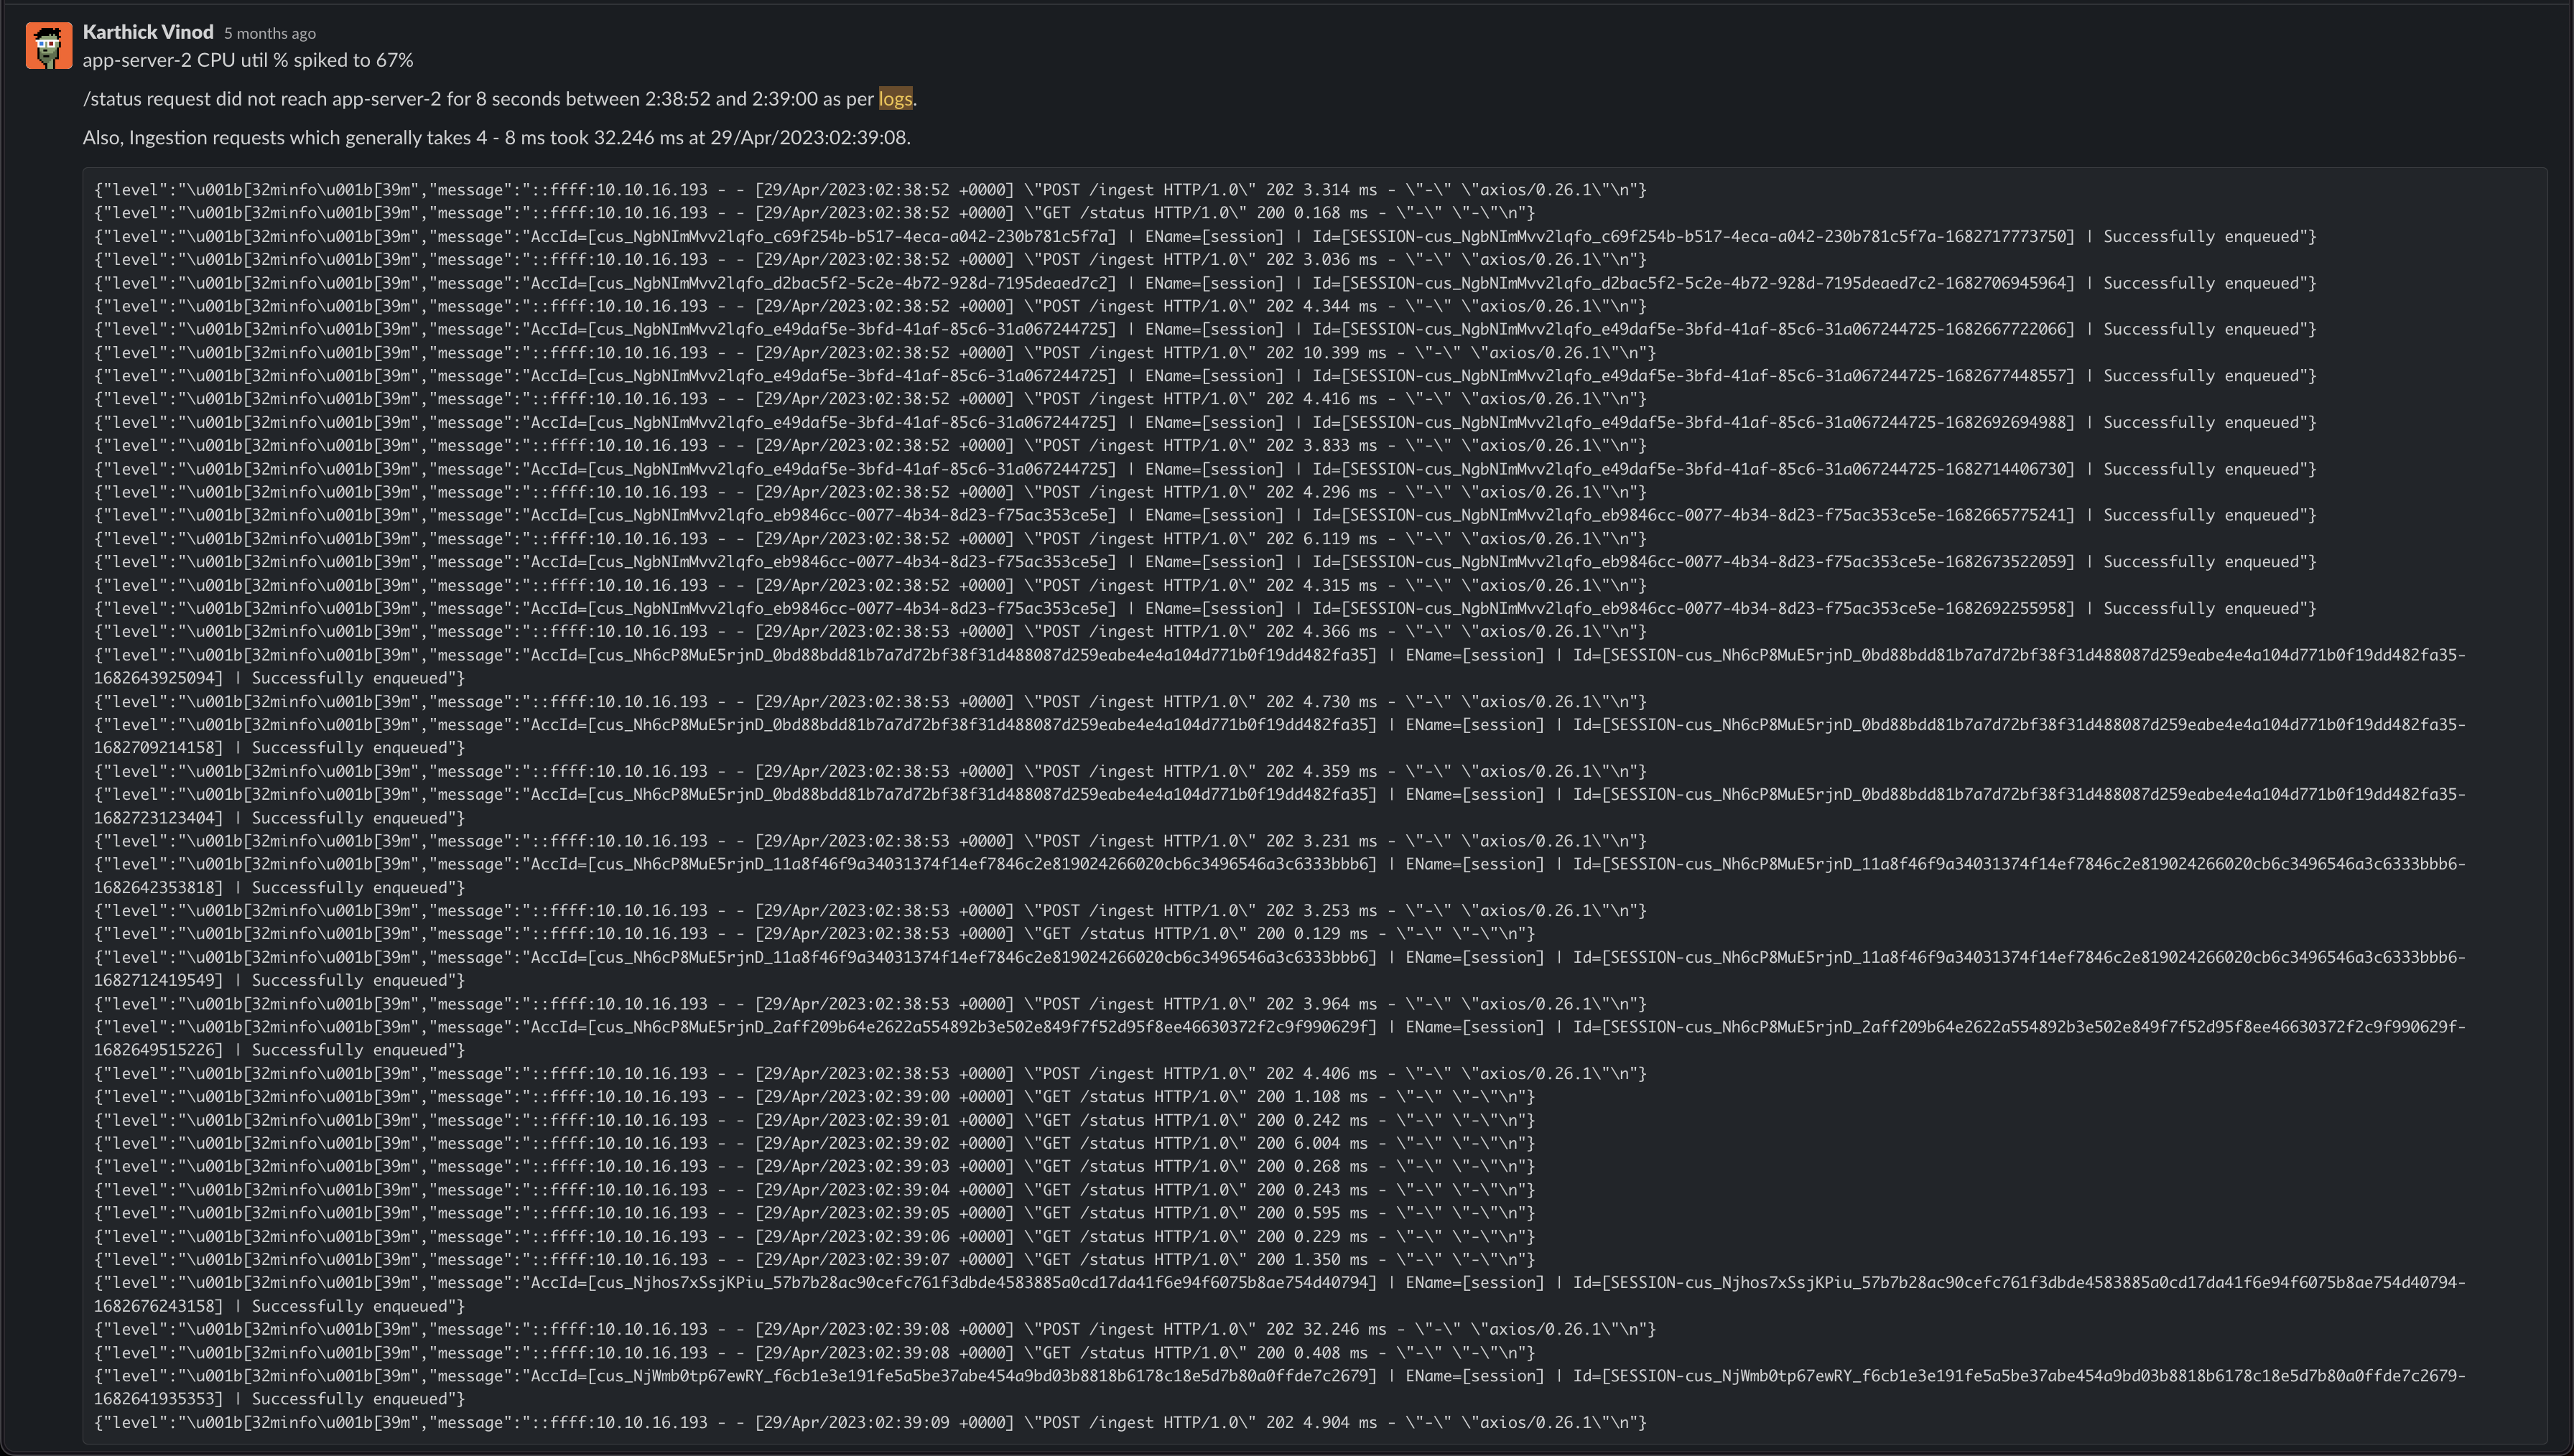
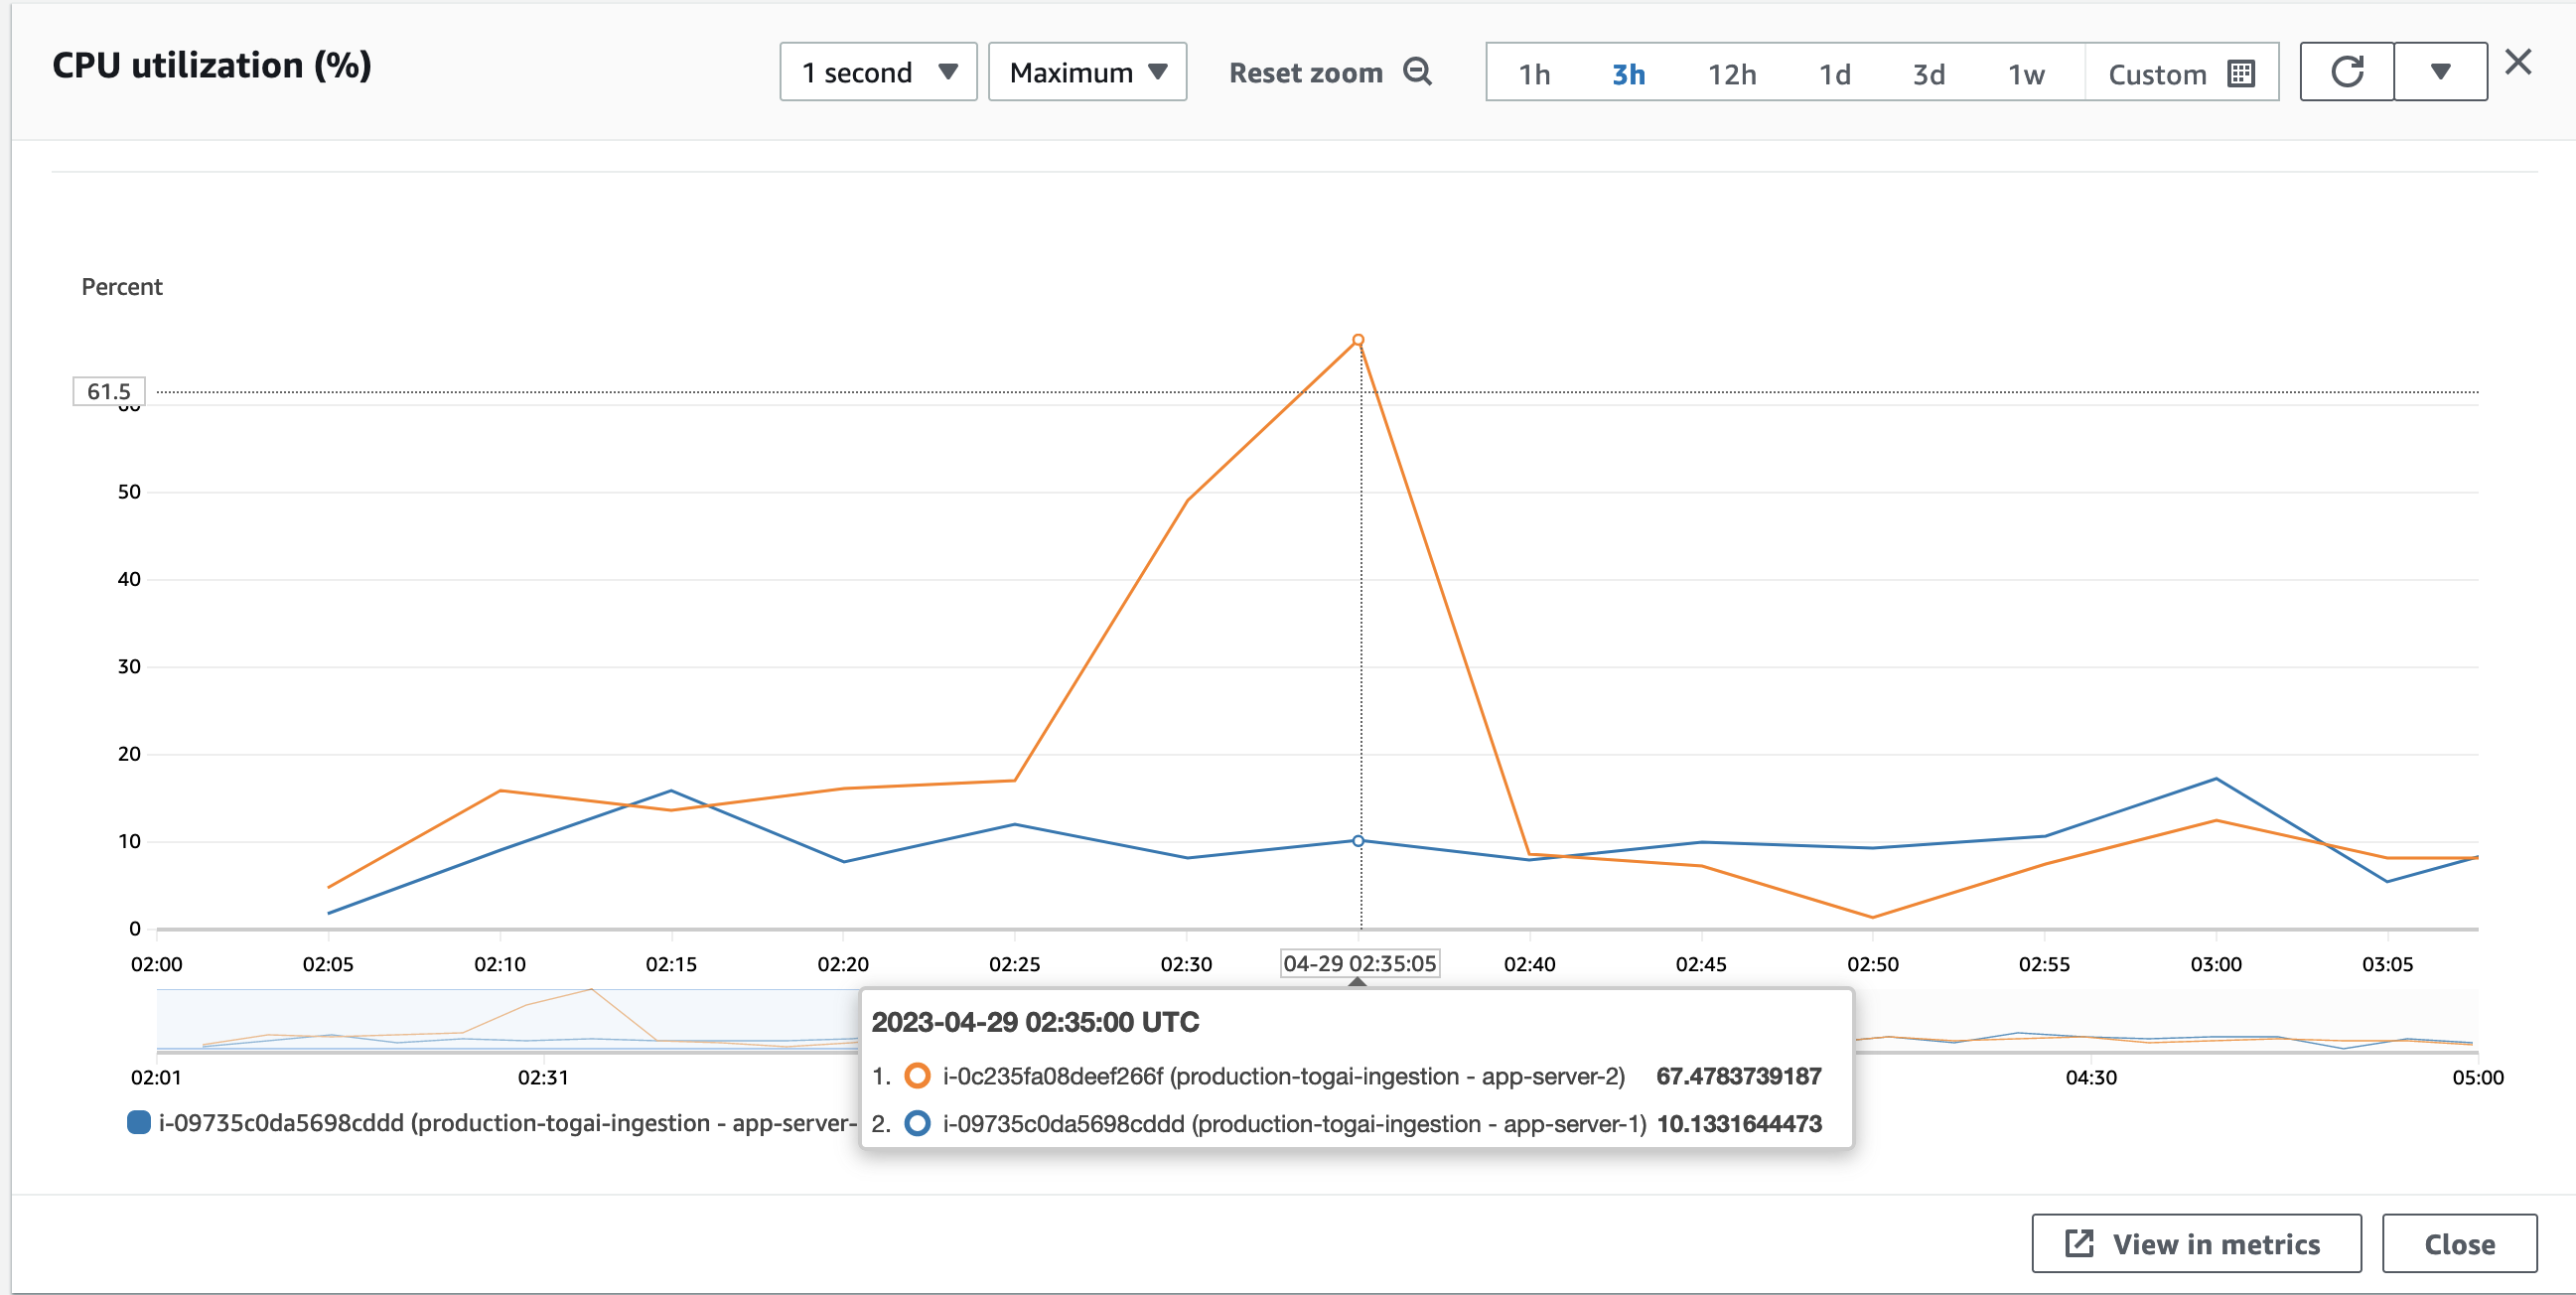
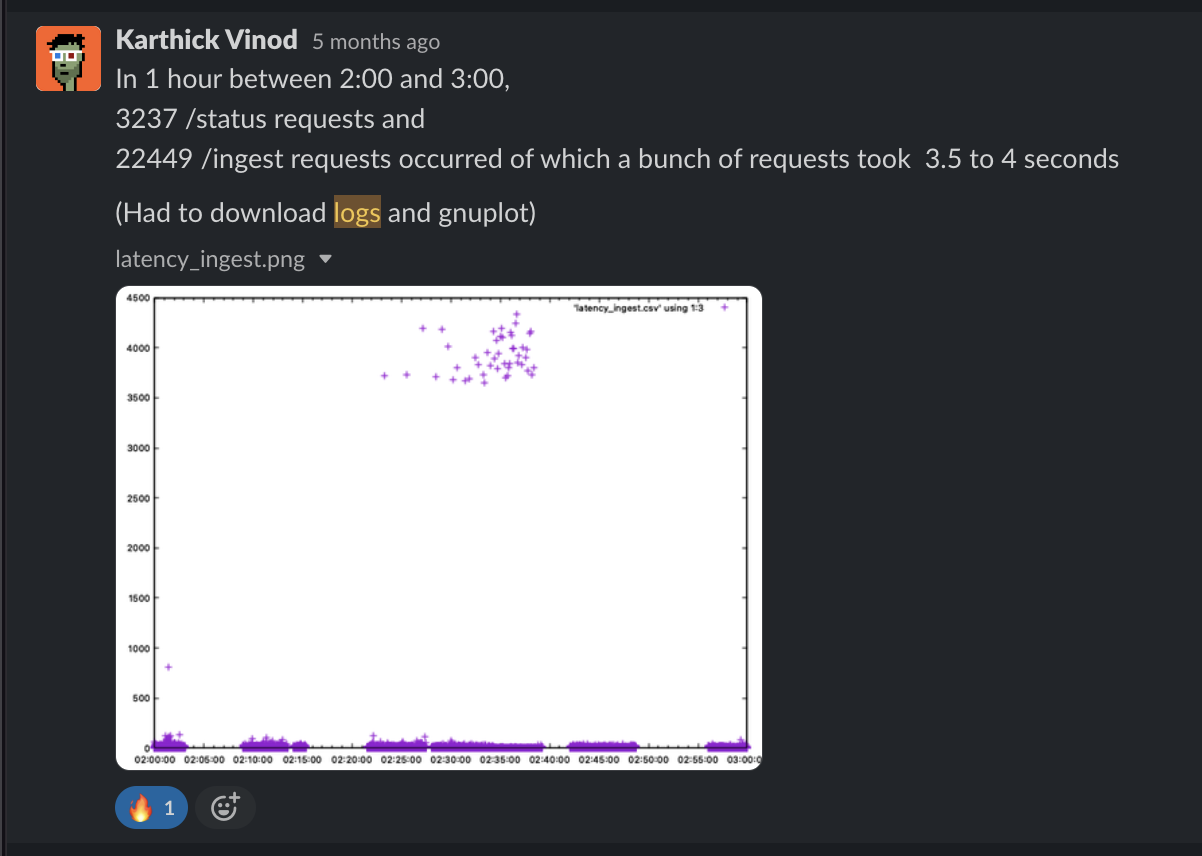
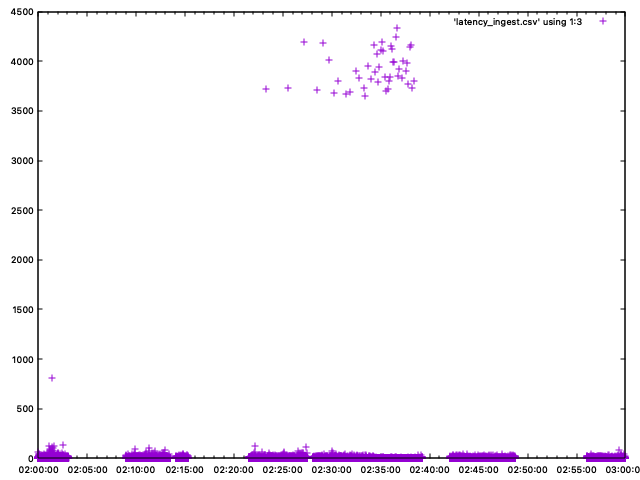
We still didn't have any answers. We just had some data. We didn't make much sense out of it - to find out why the whole thing happened. We didn't know the root cause of the issue
Then the issue happened again on May 4th, 2023, at 8:19 pm IST
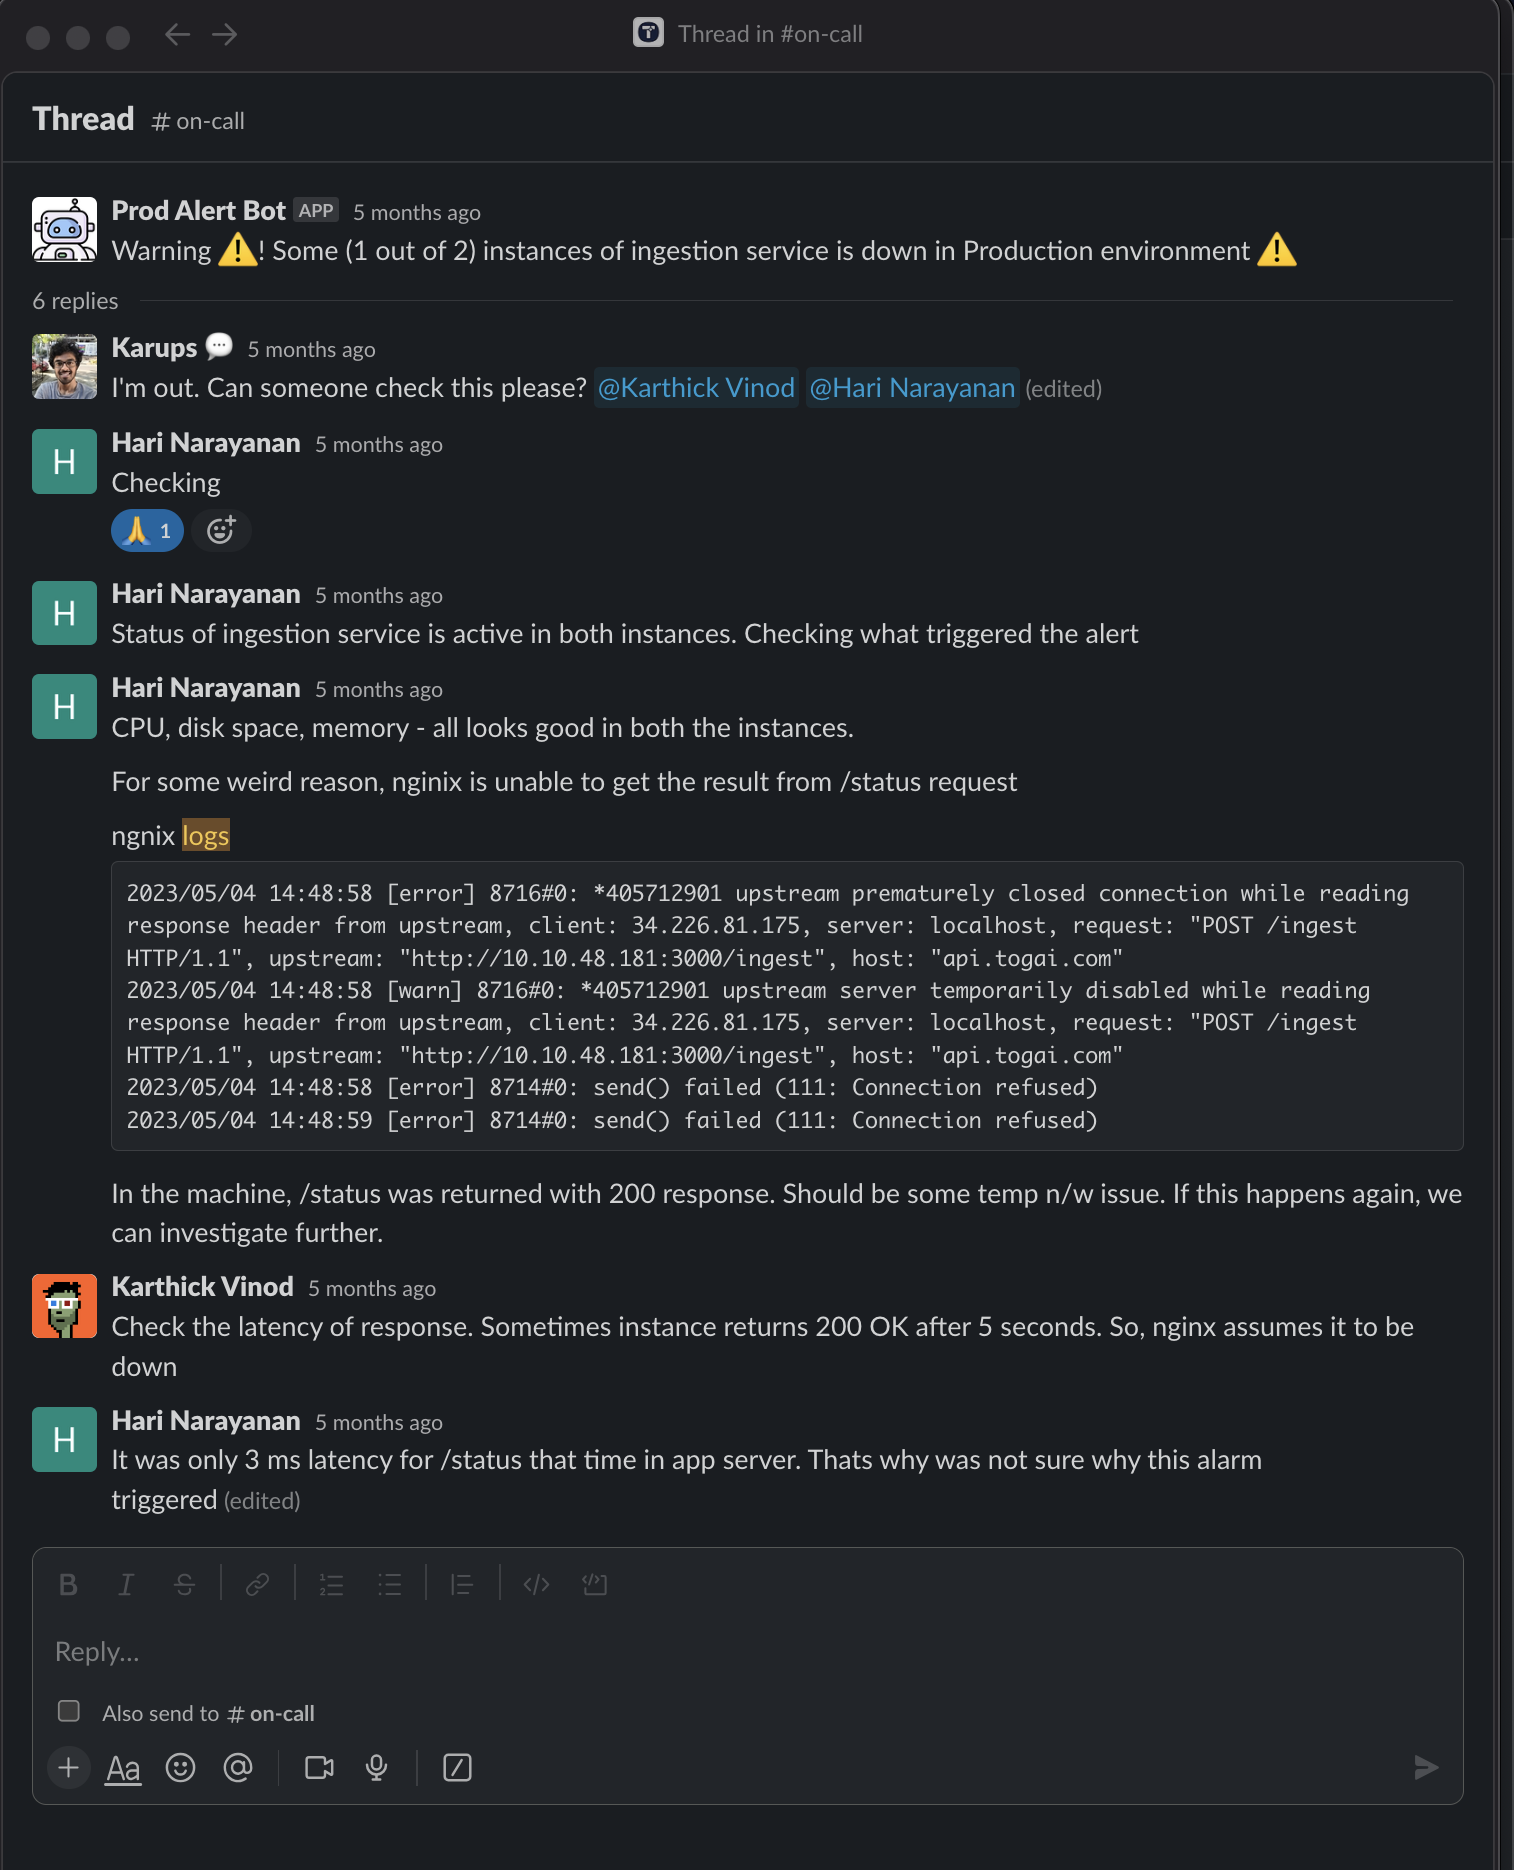
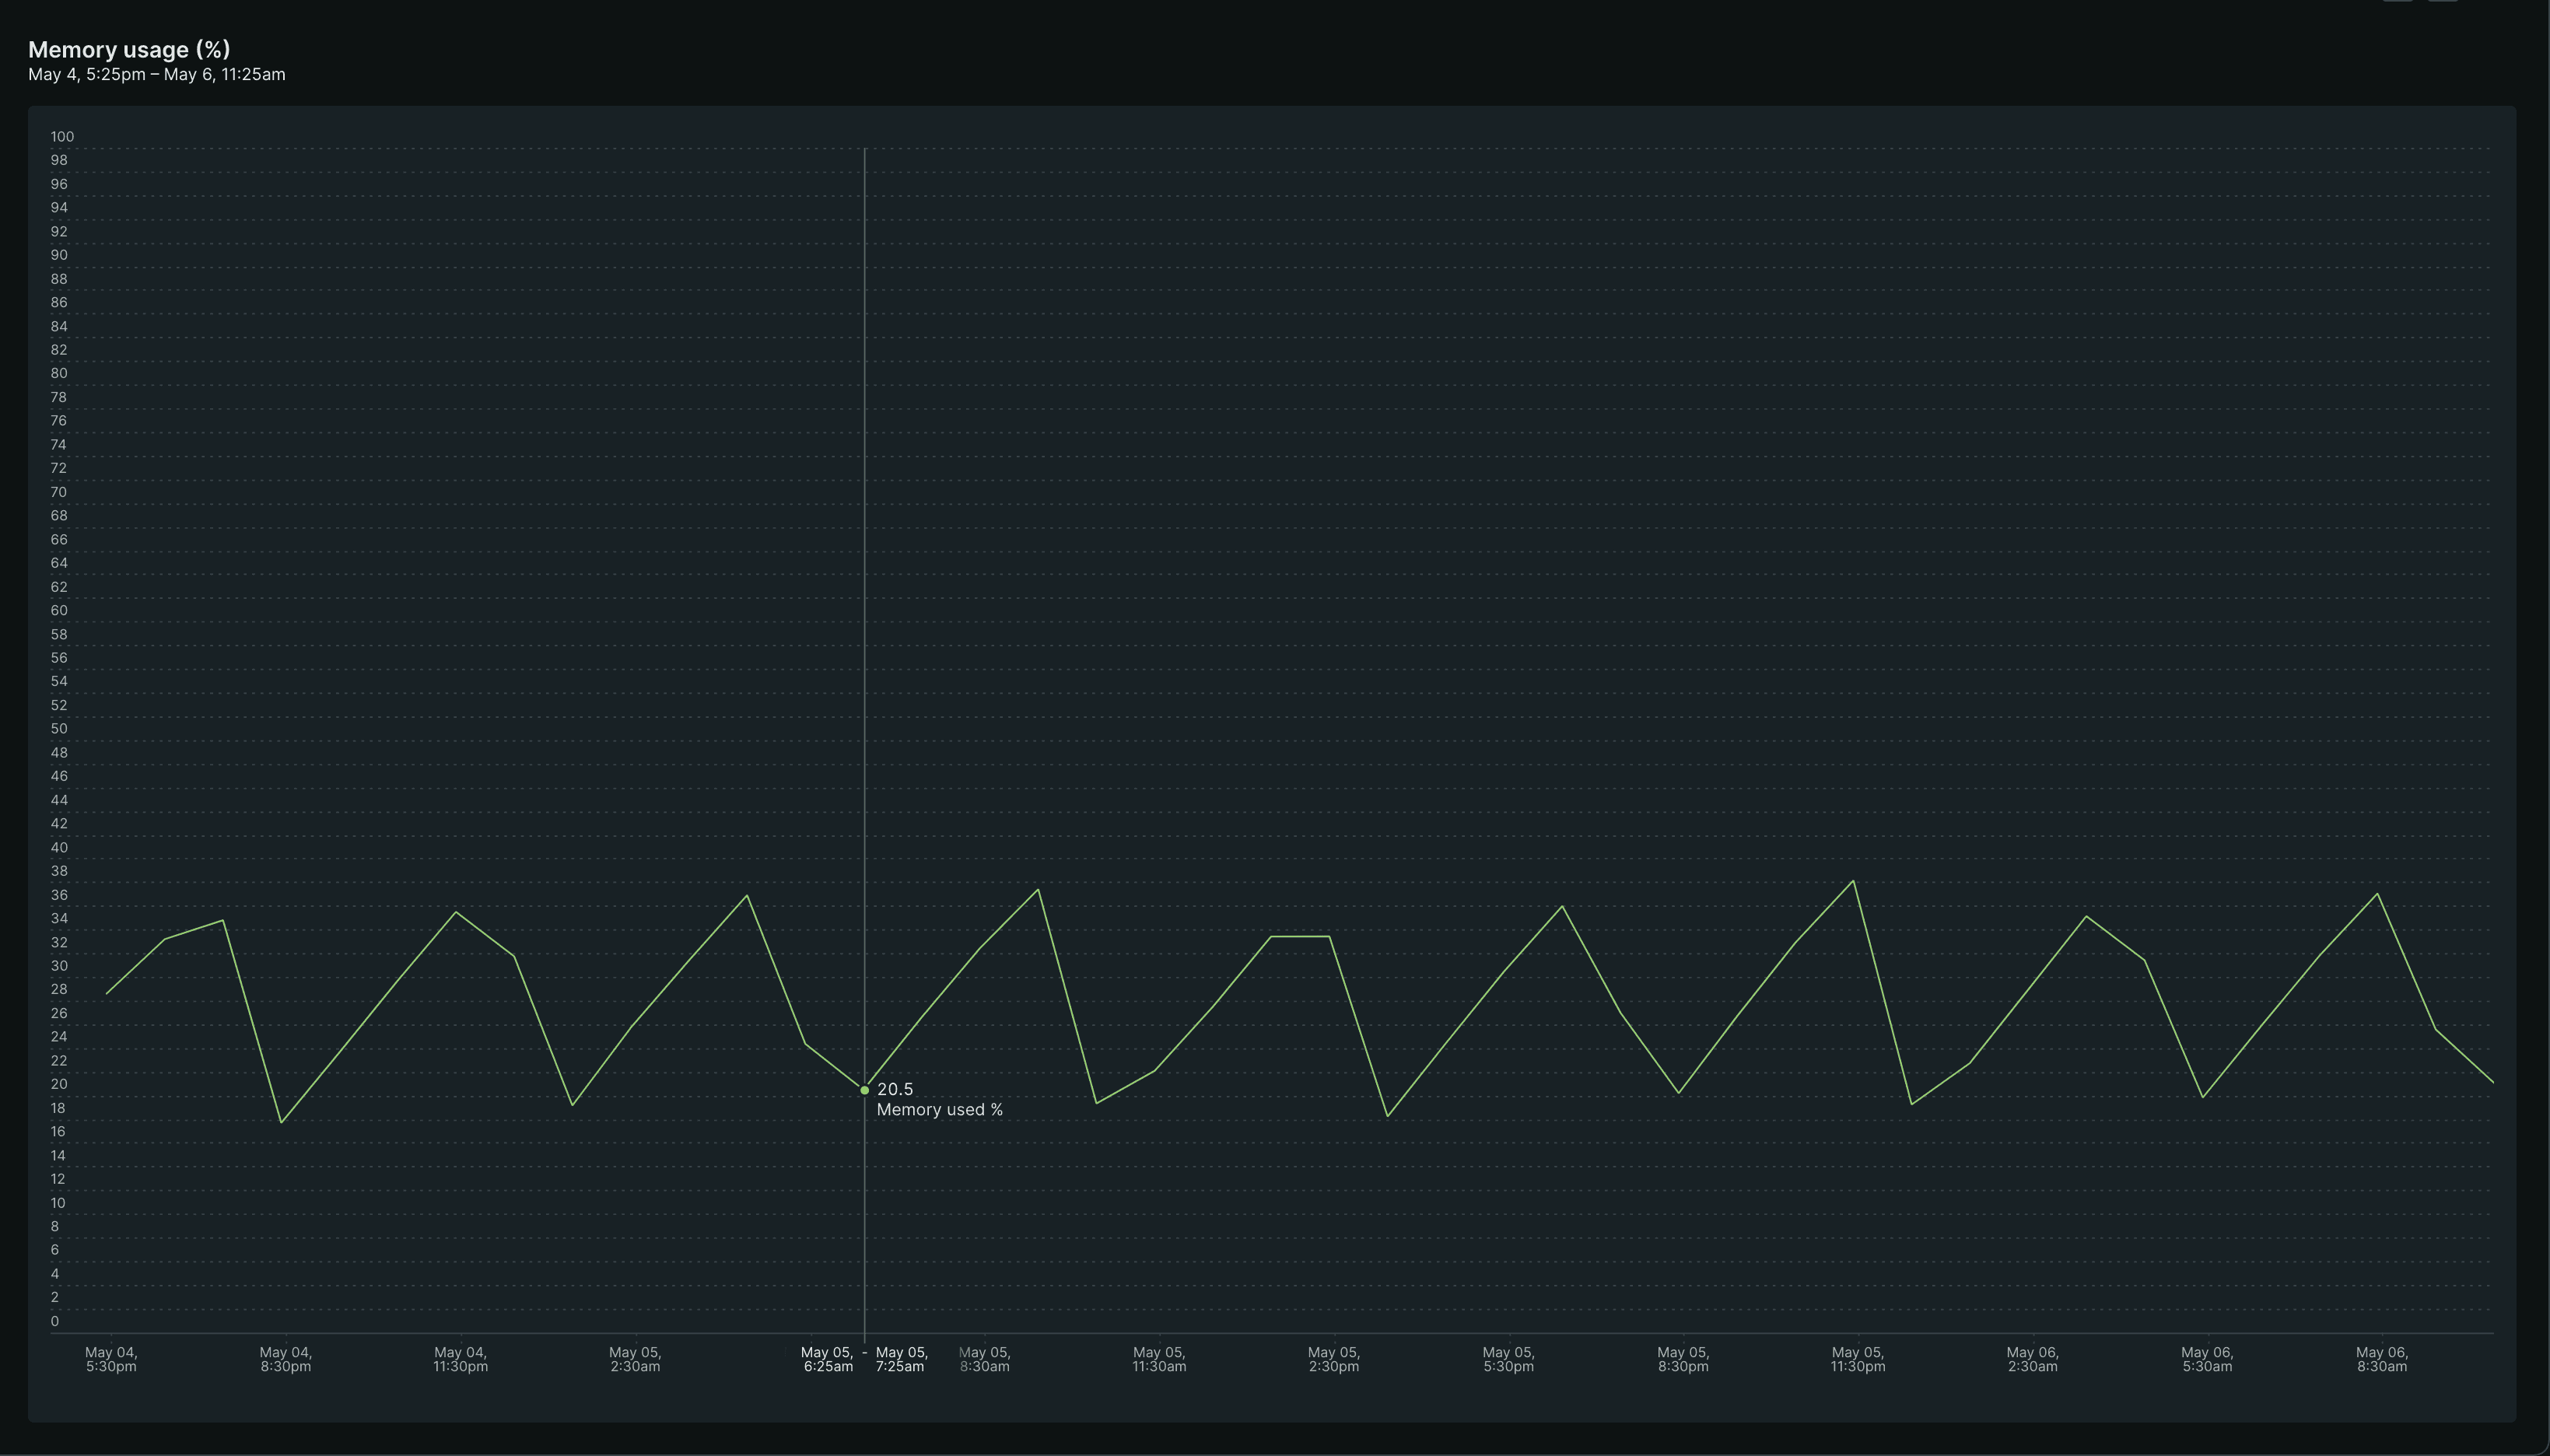
Looking at the New Relic dashboards at the time - it's clear that there was a memory issue
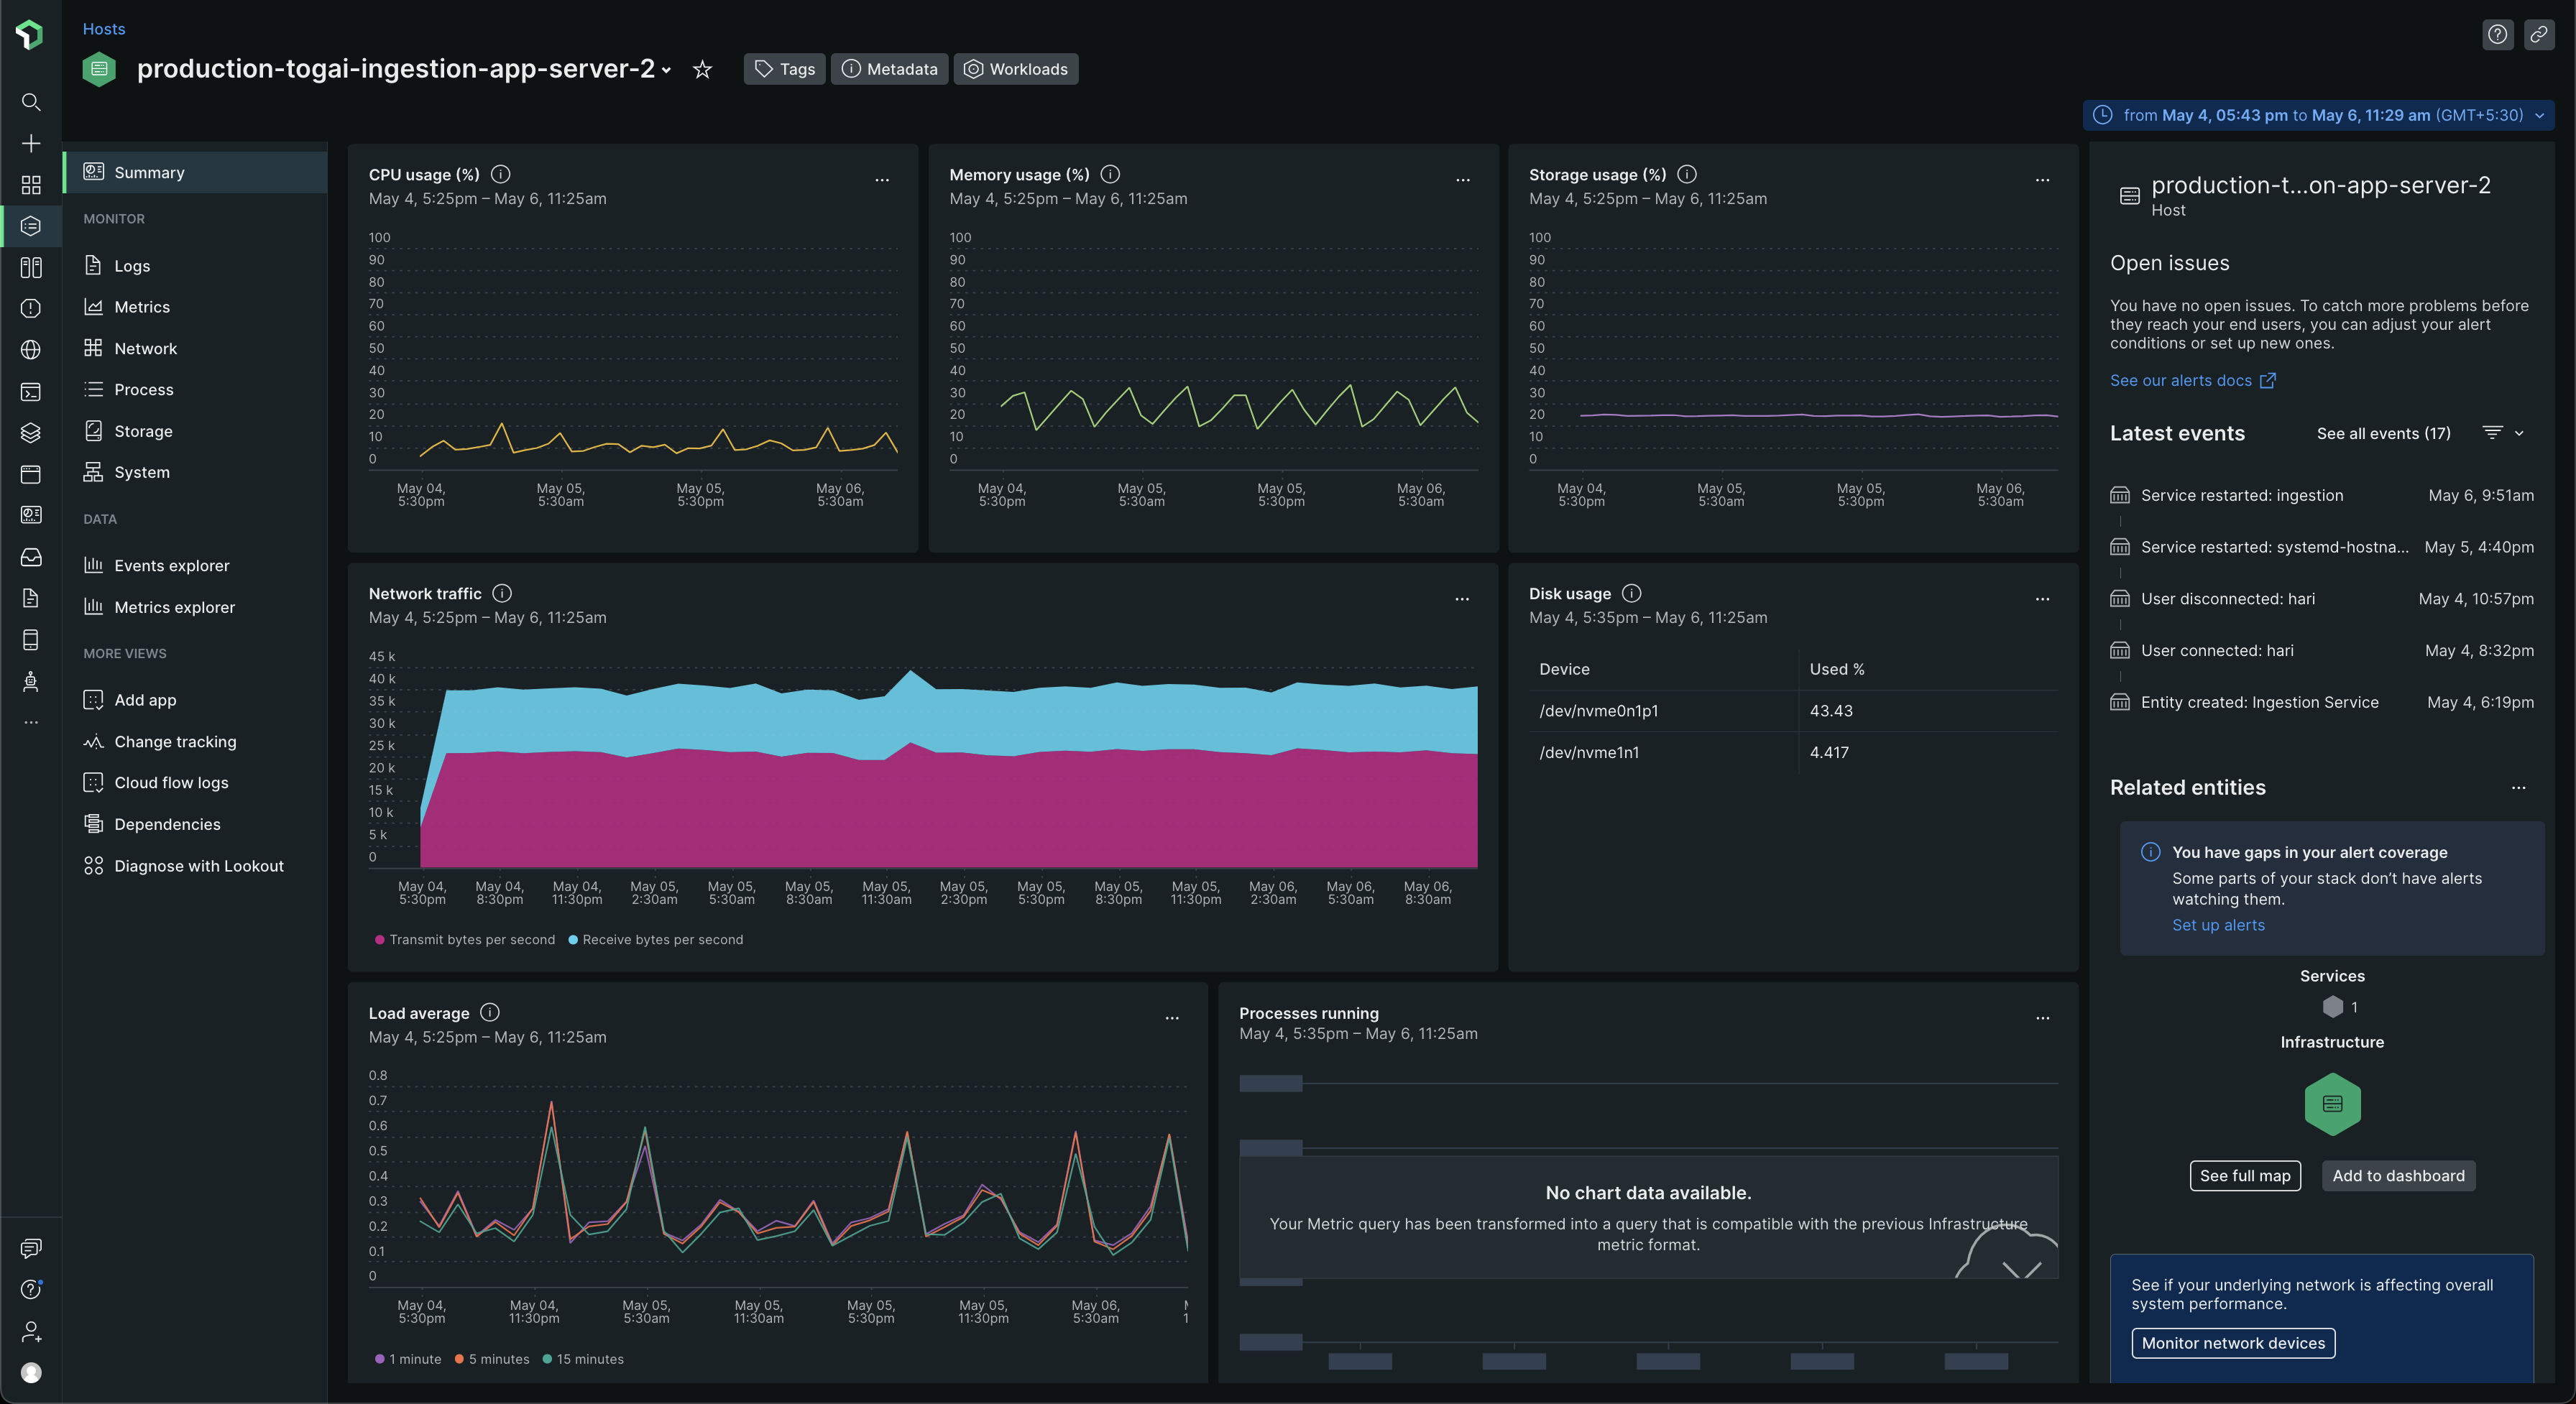
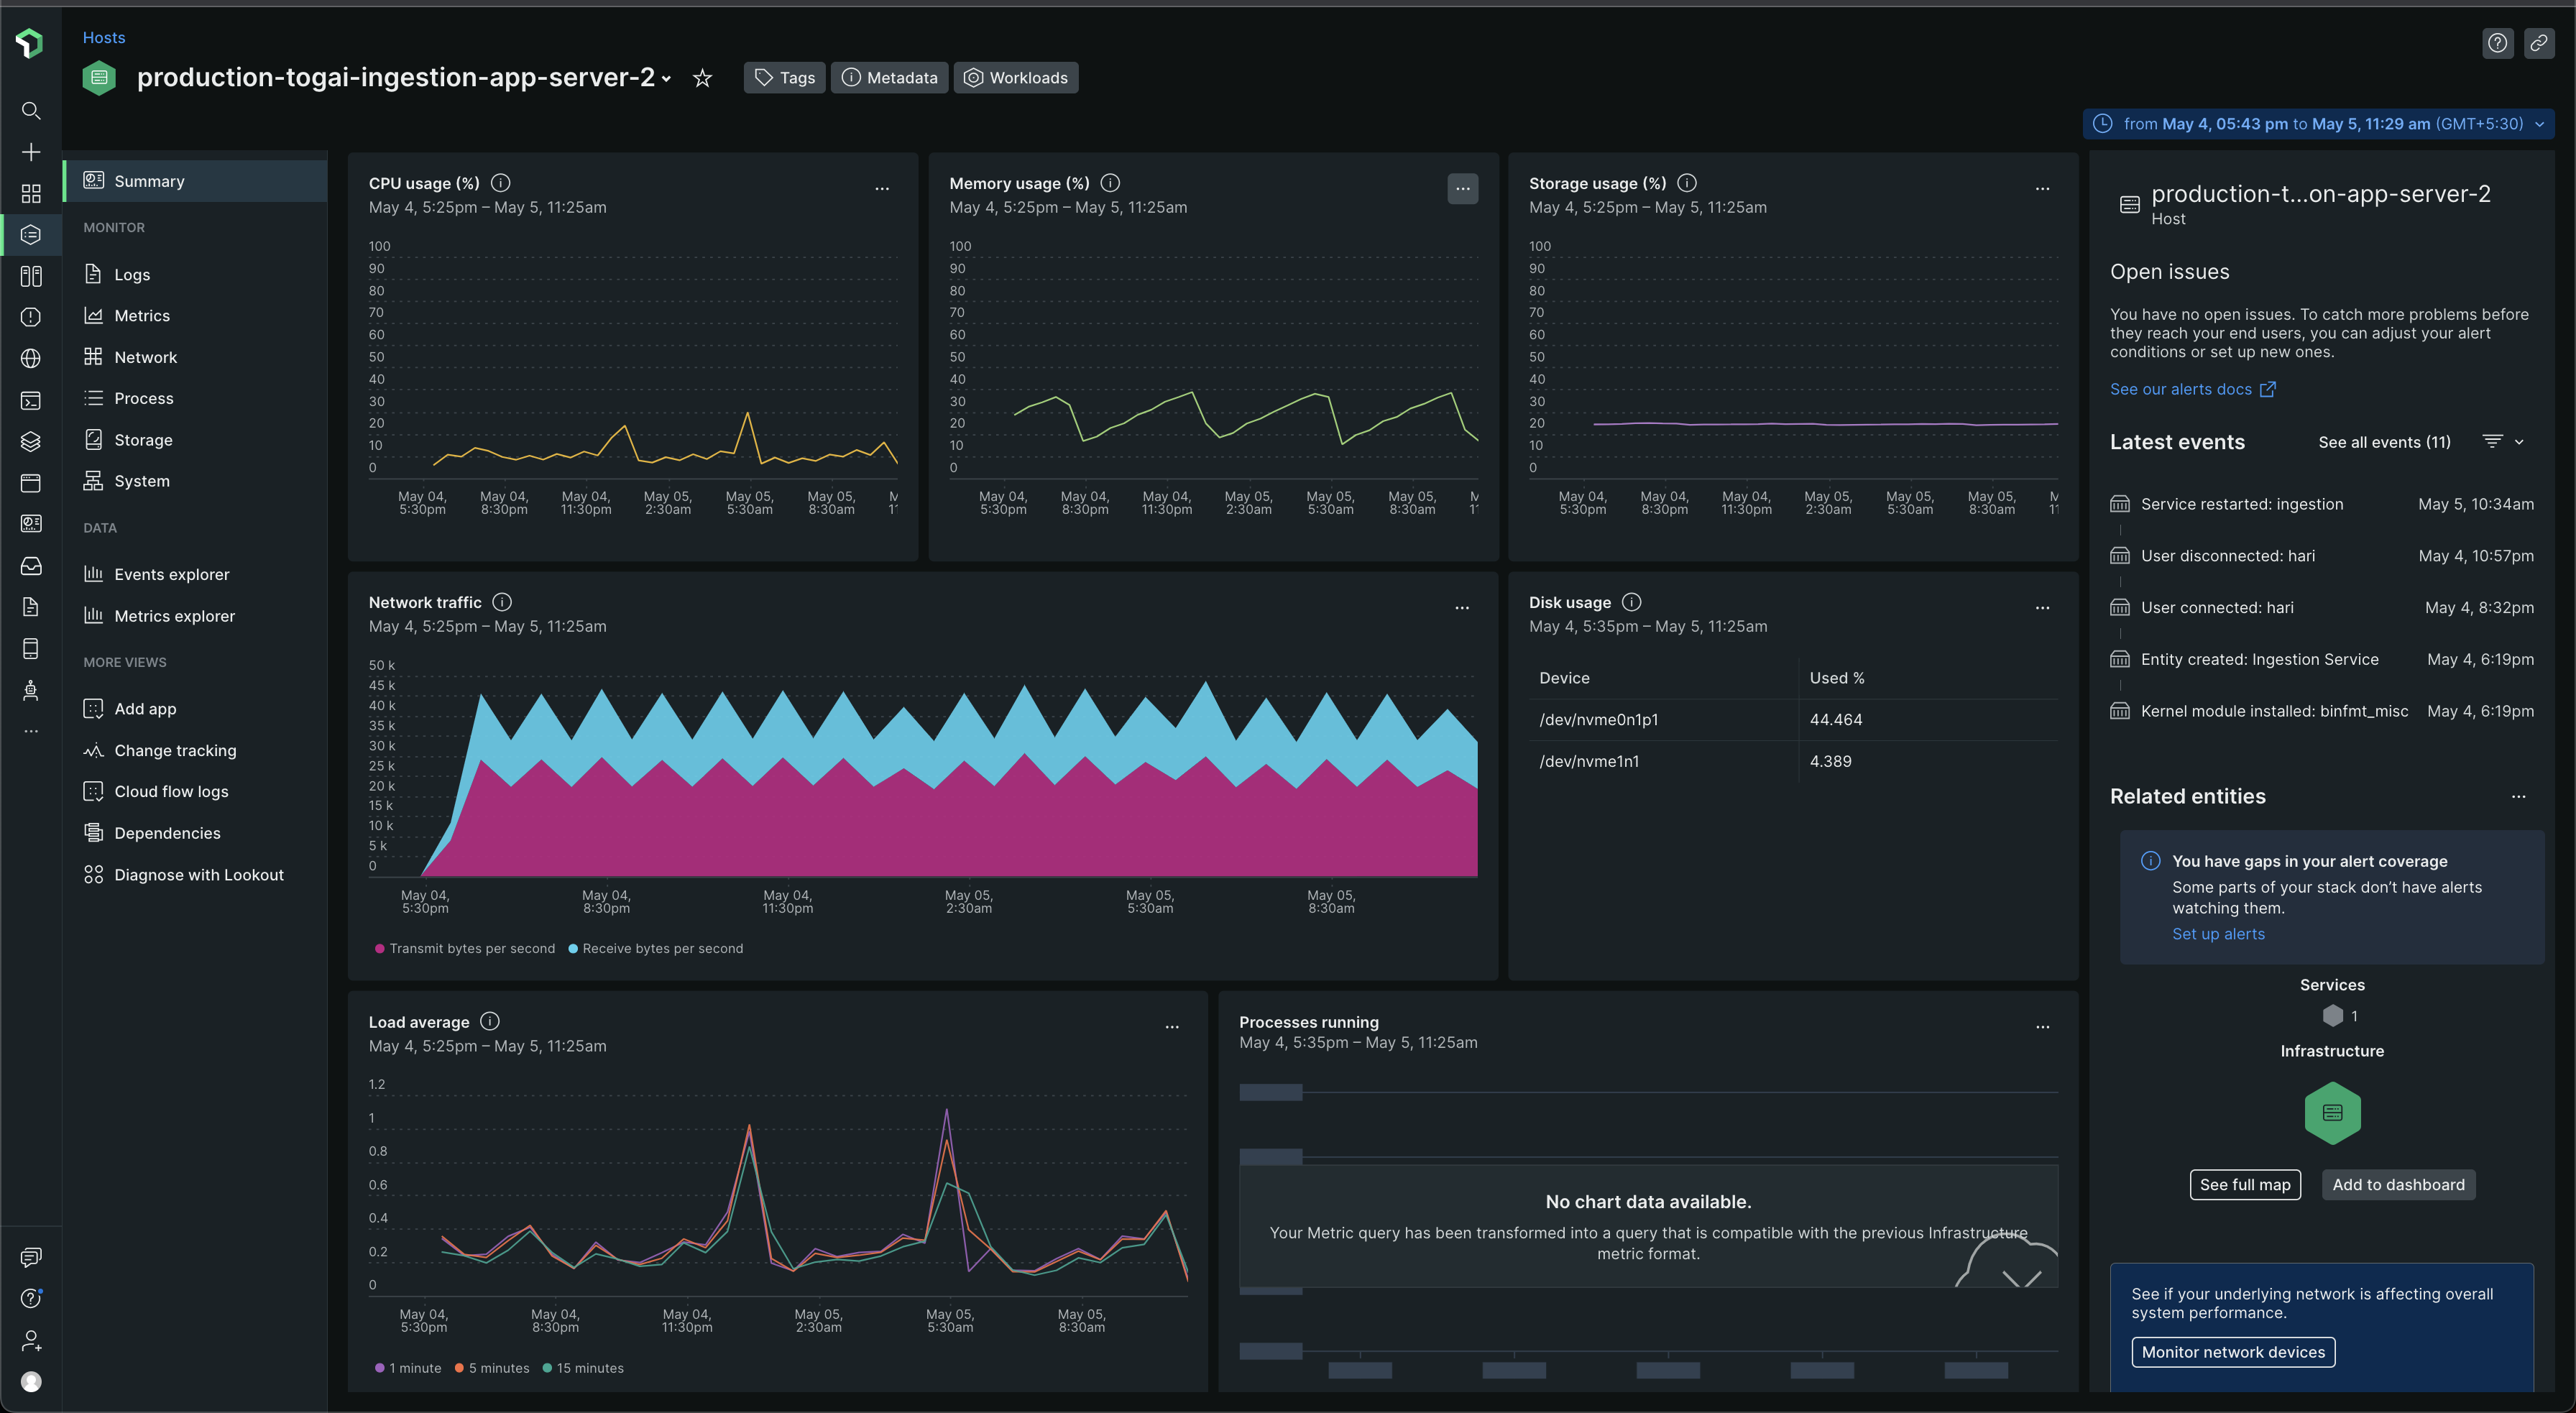
As you can see, for the memory usage (%) graph, there's a sine/cosine (cos) wave 🌊 which goes up and down in a pattern
Again, at the time, we didn't find the root cause of this issue. Or you could say we couldn't find the root cause - because we didn't look deeper, dig deeper
Below are the number of times we got alerted that Ingestion service was down
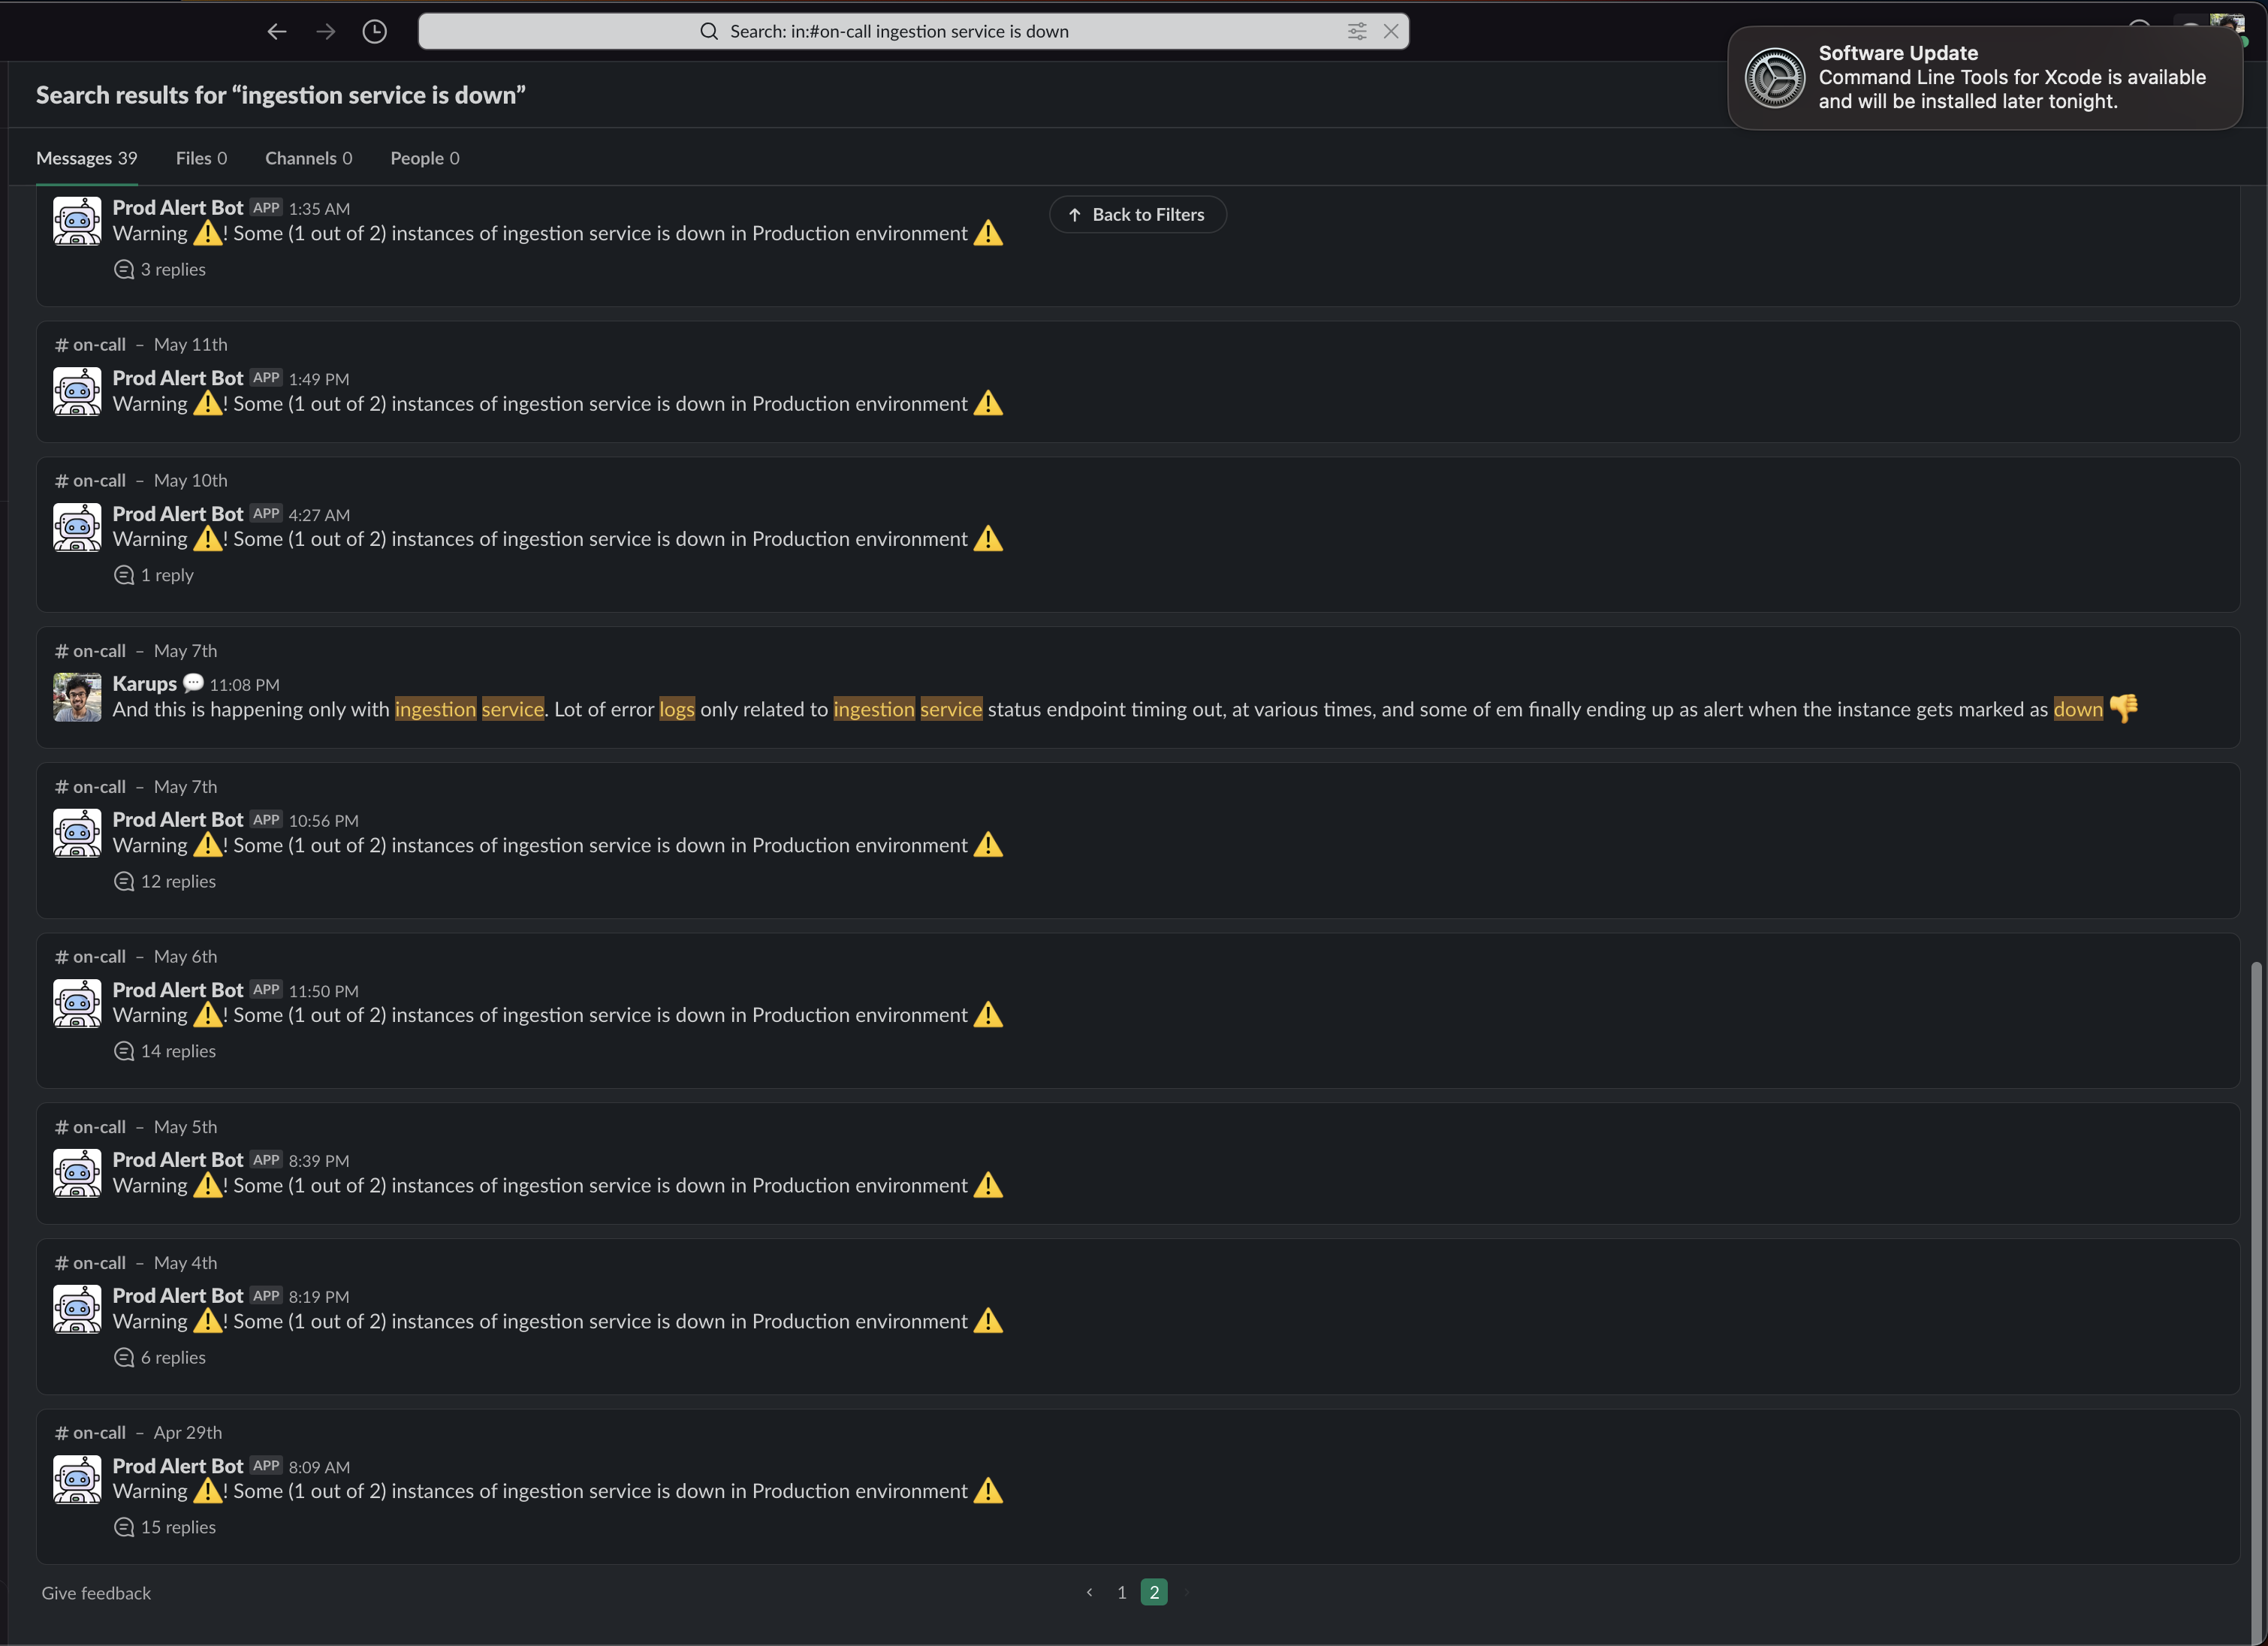
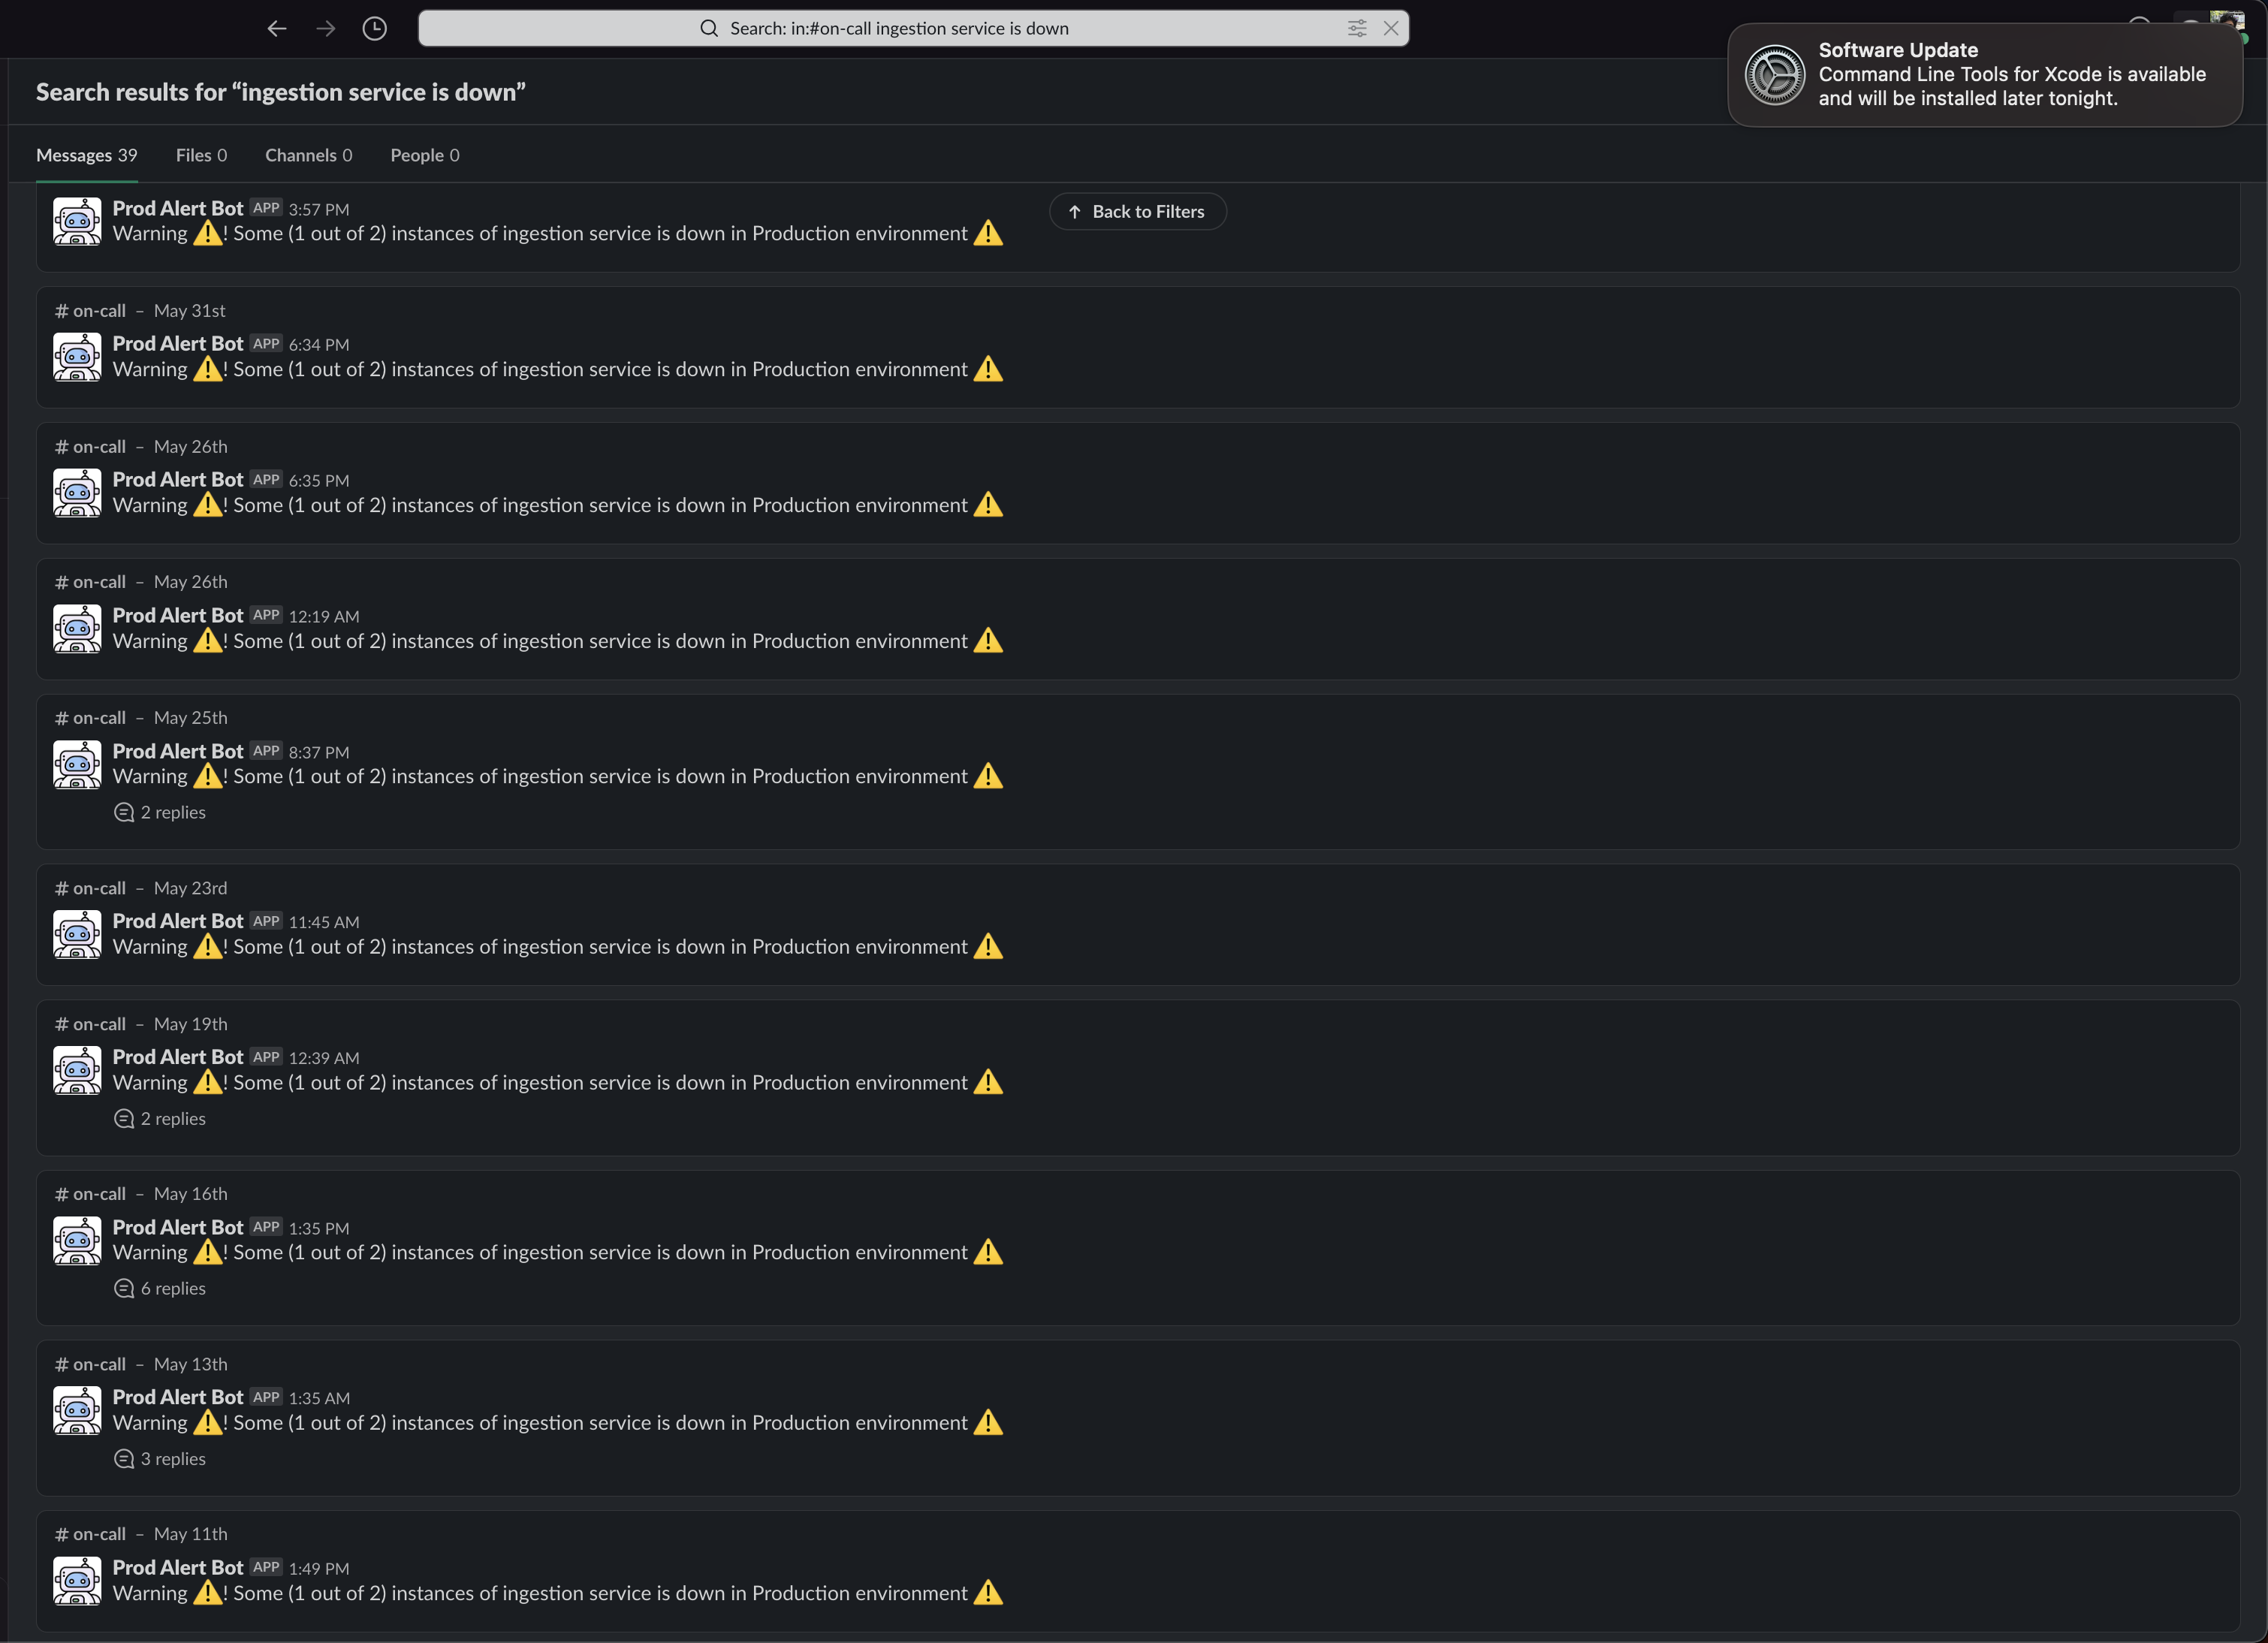
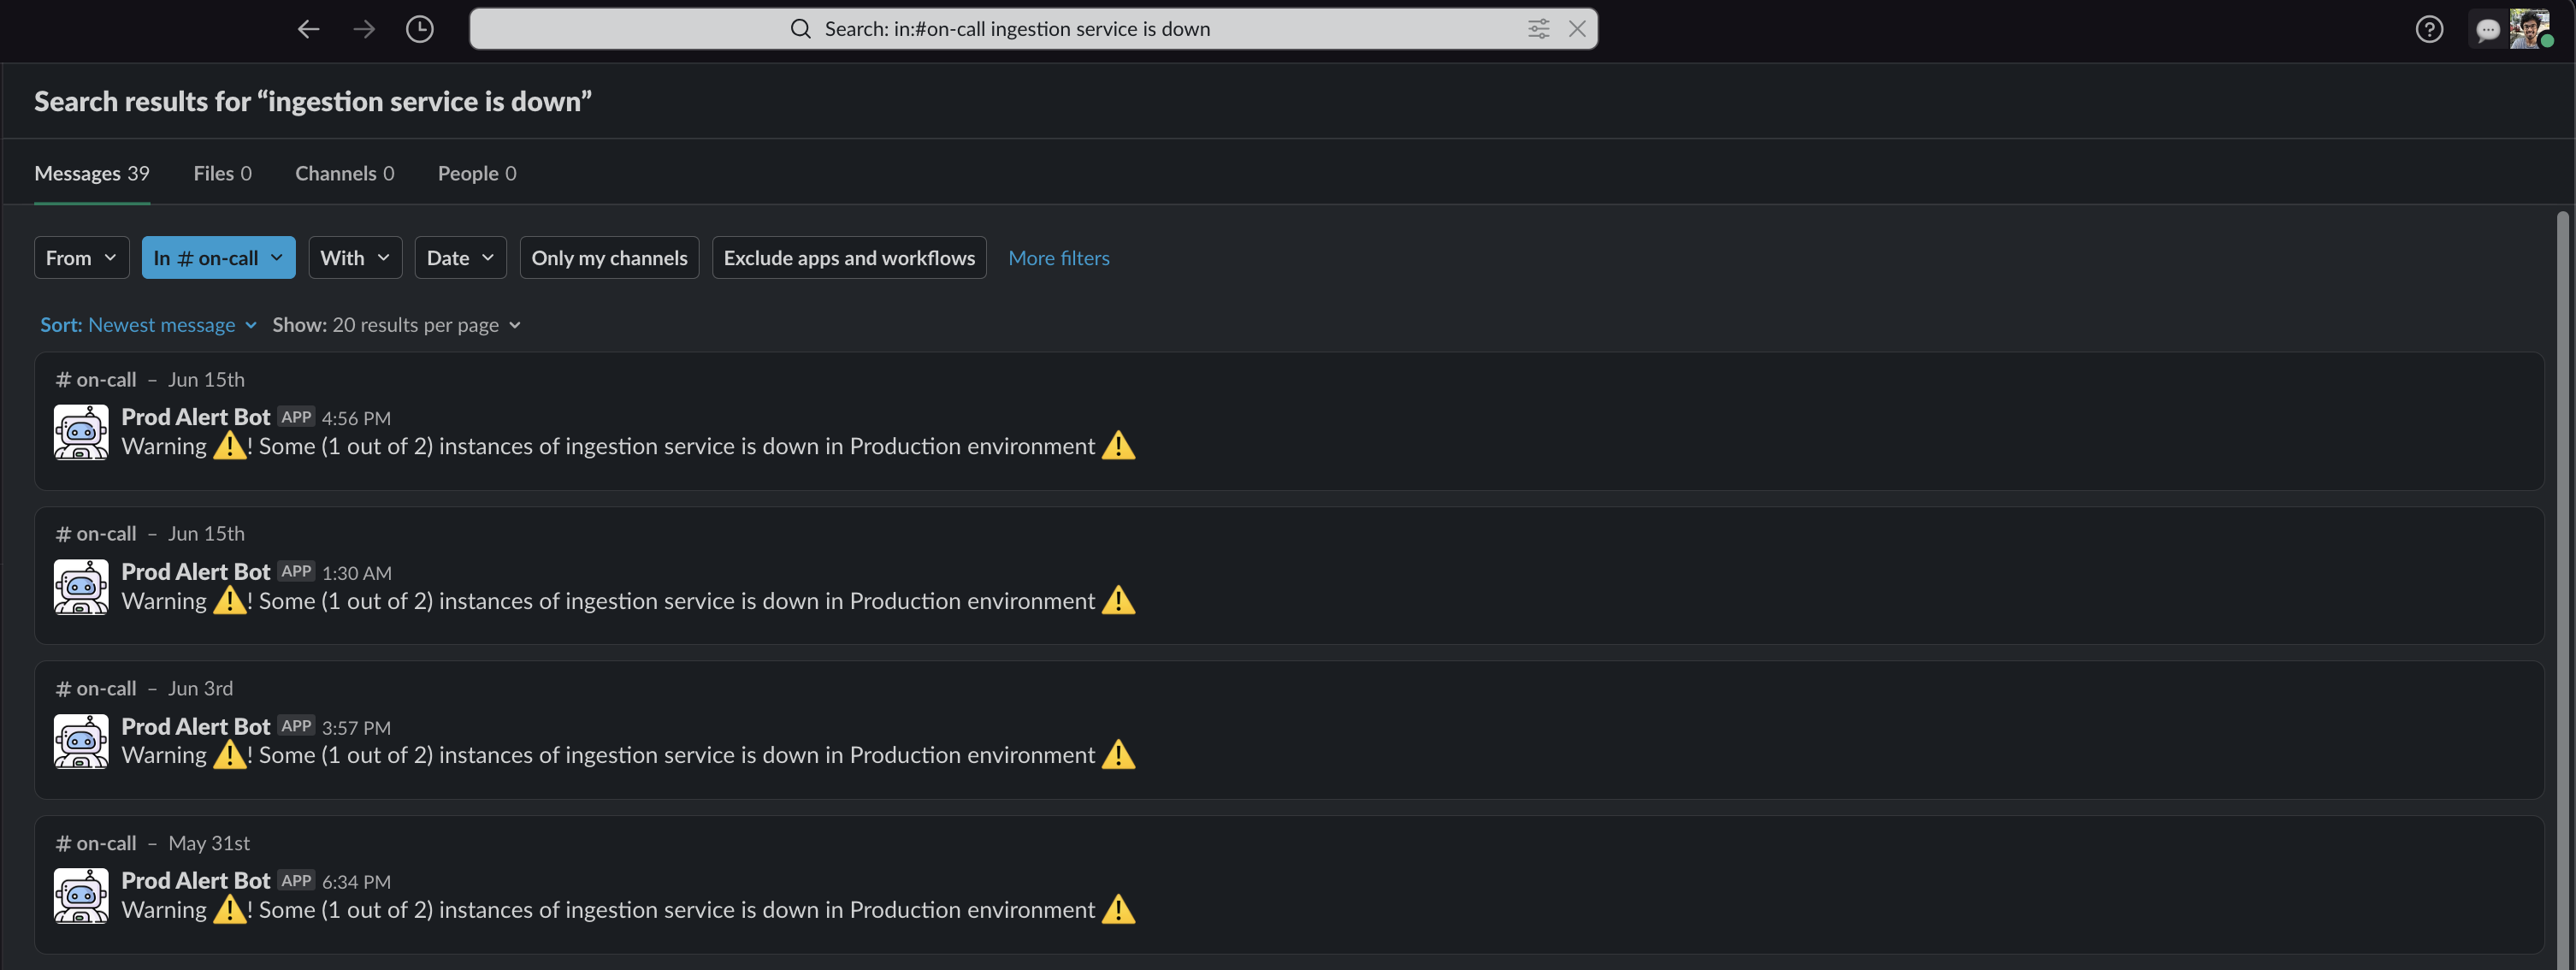
Some of the Slack threads 🧵 where we discussed the issue
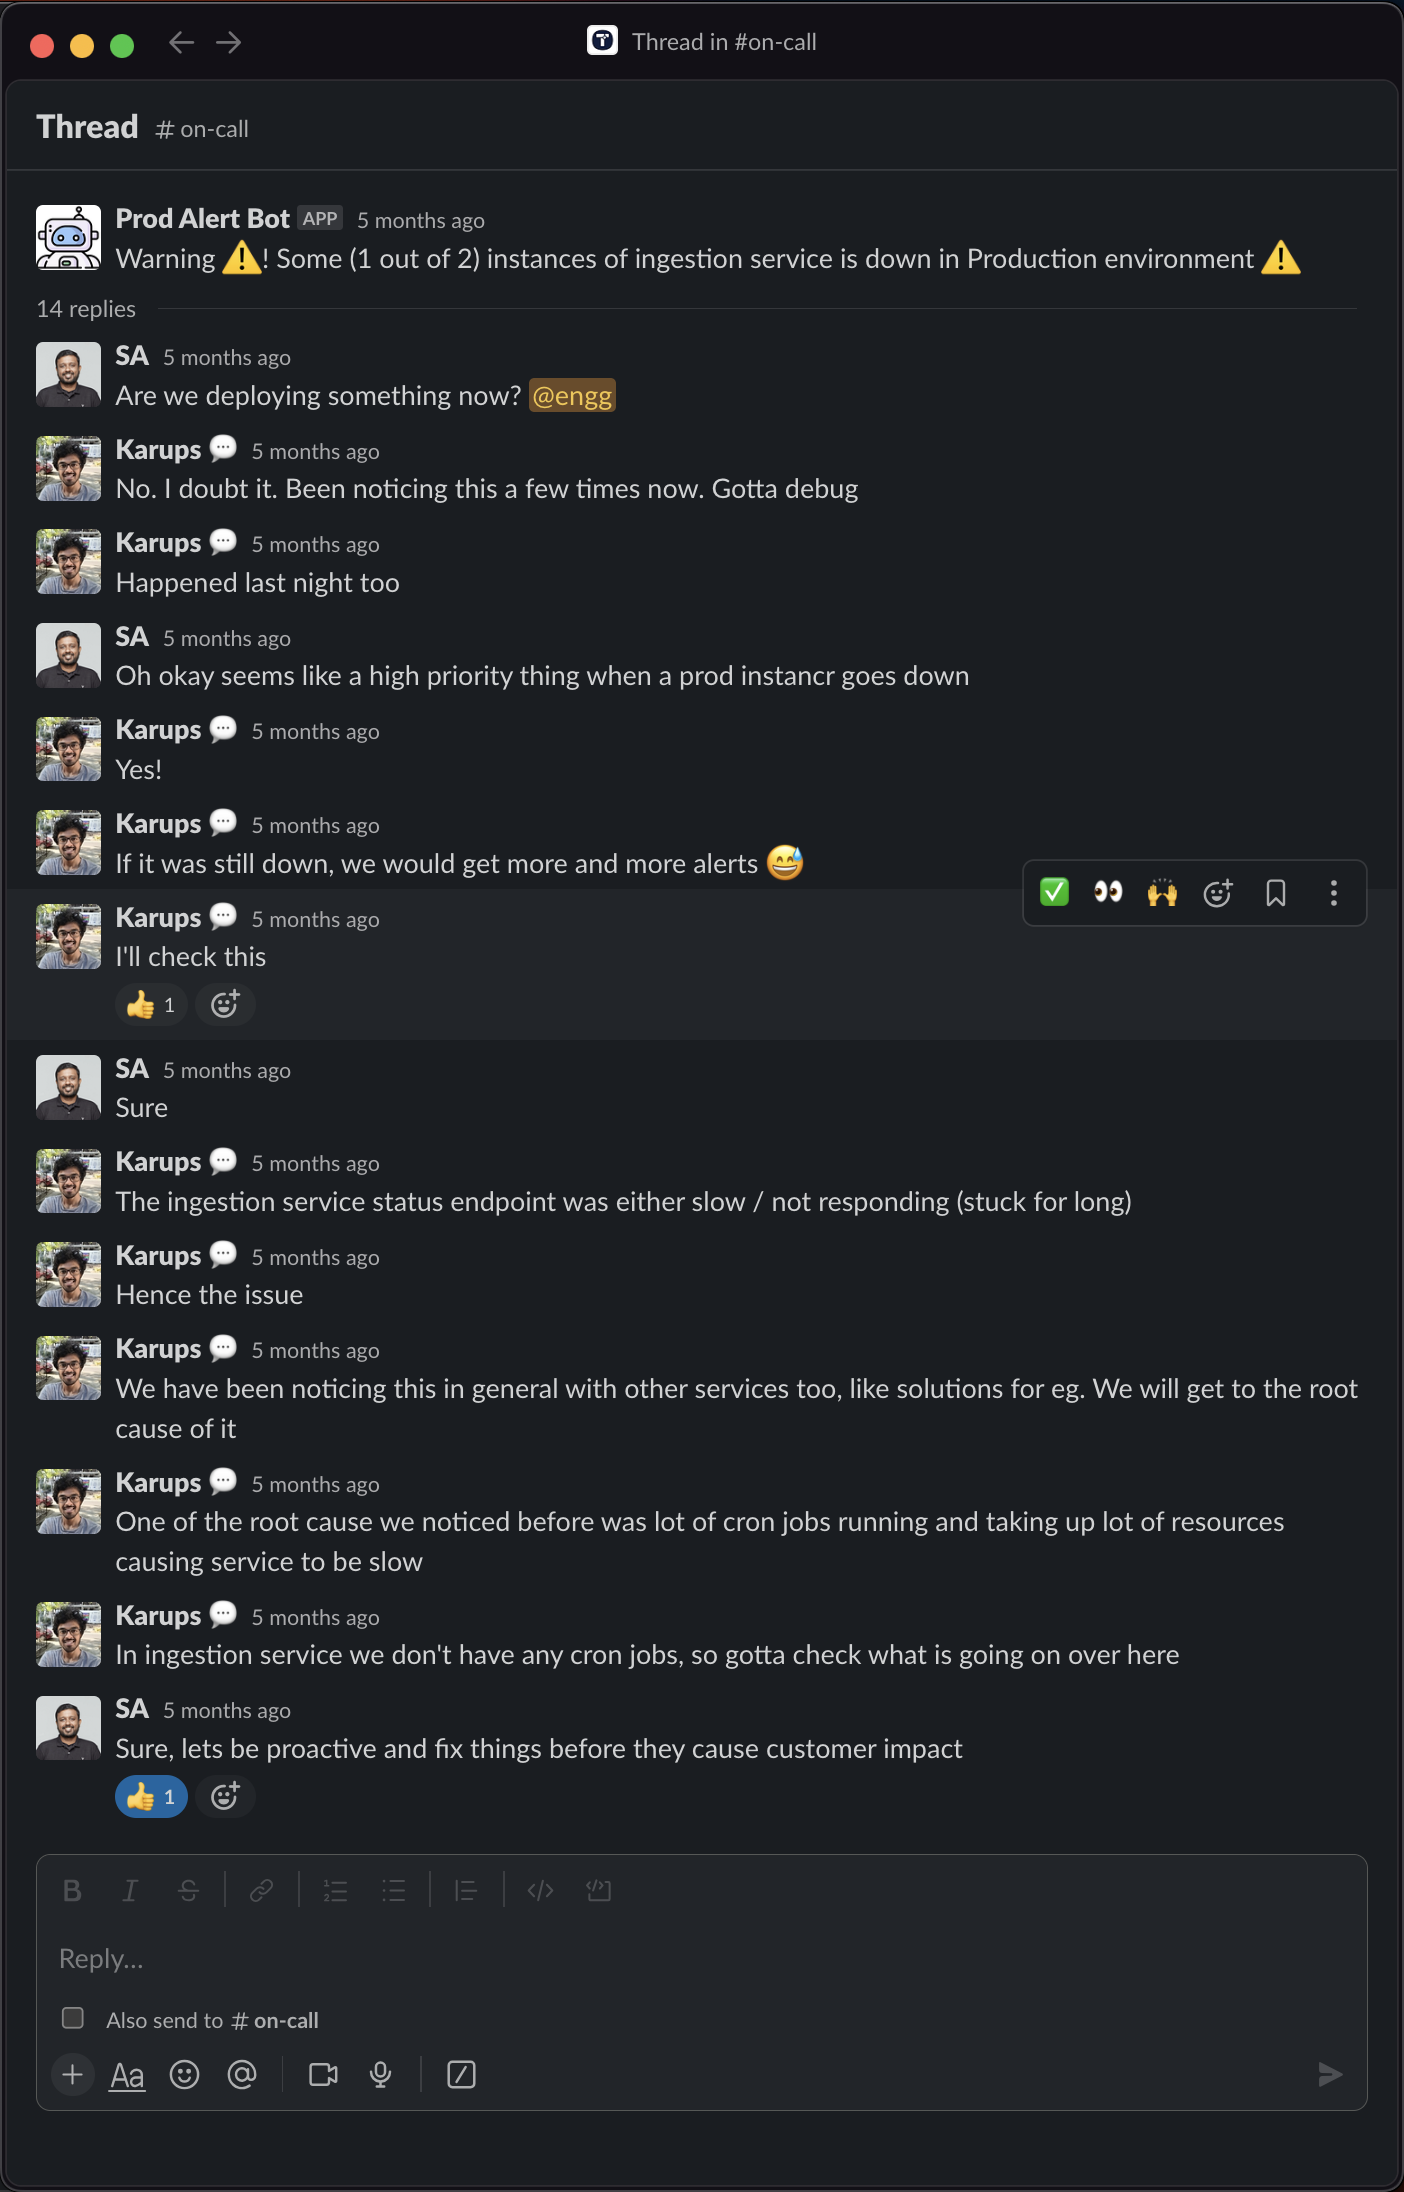
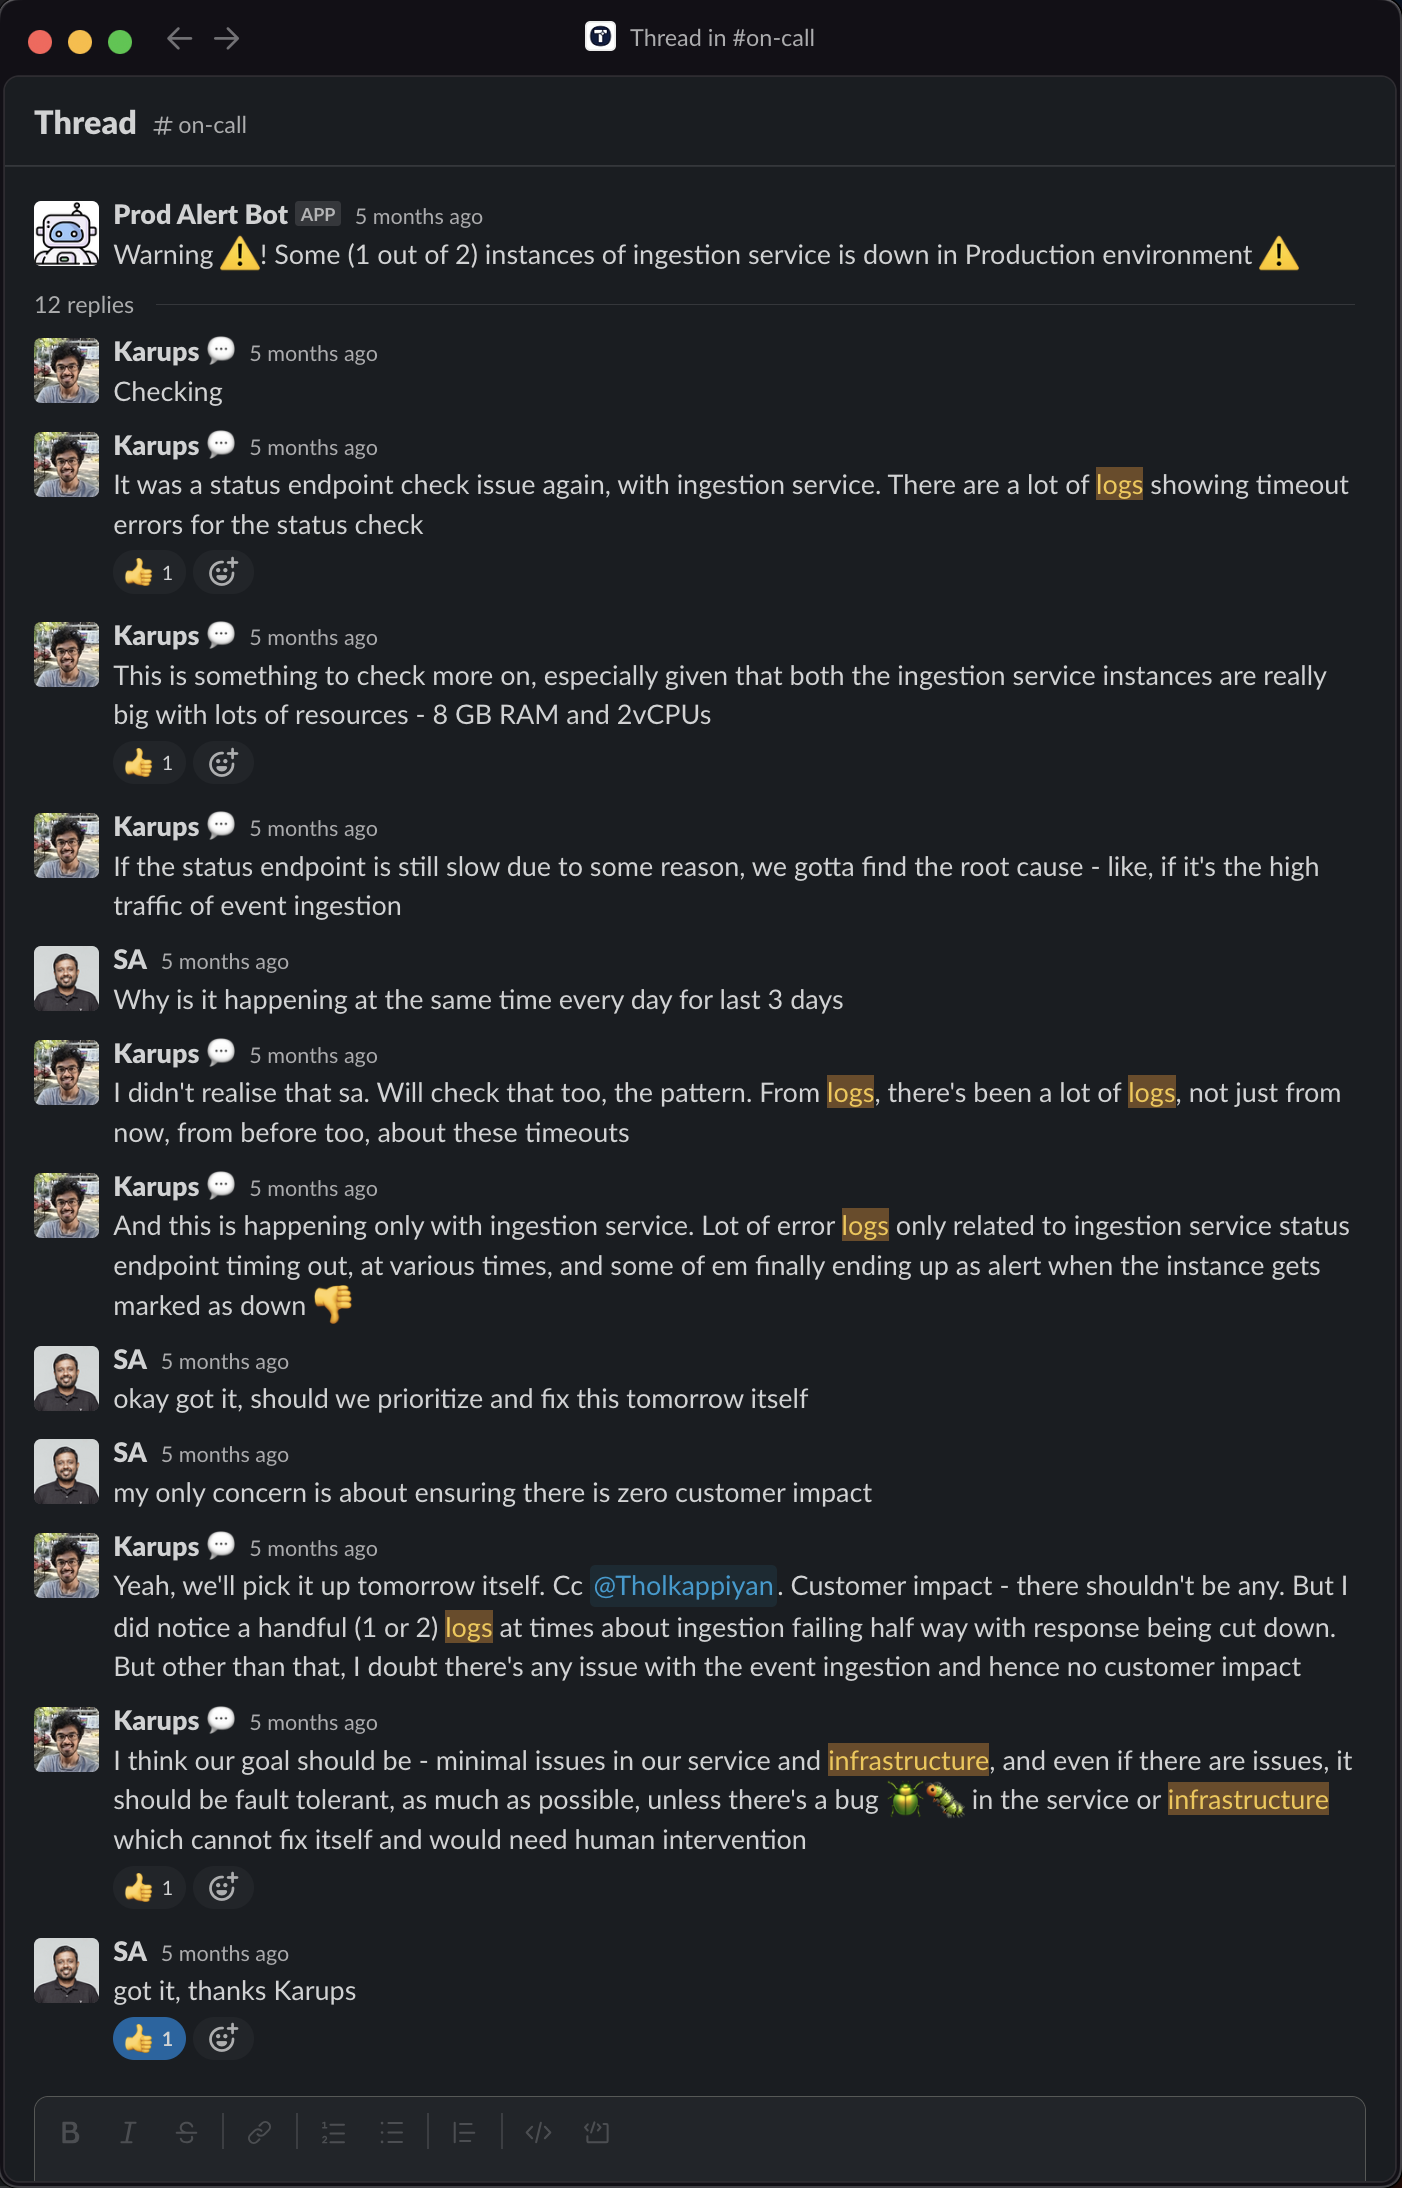
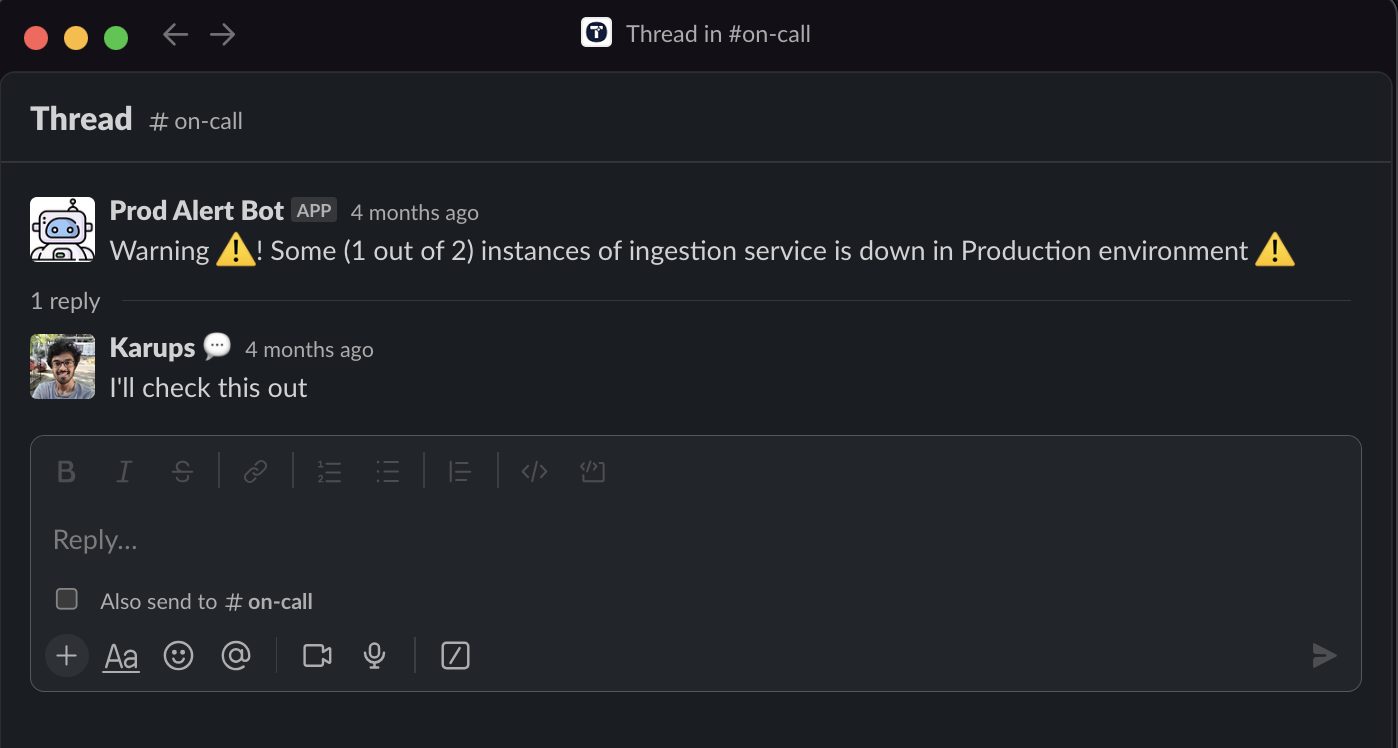
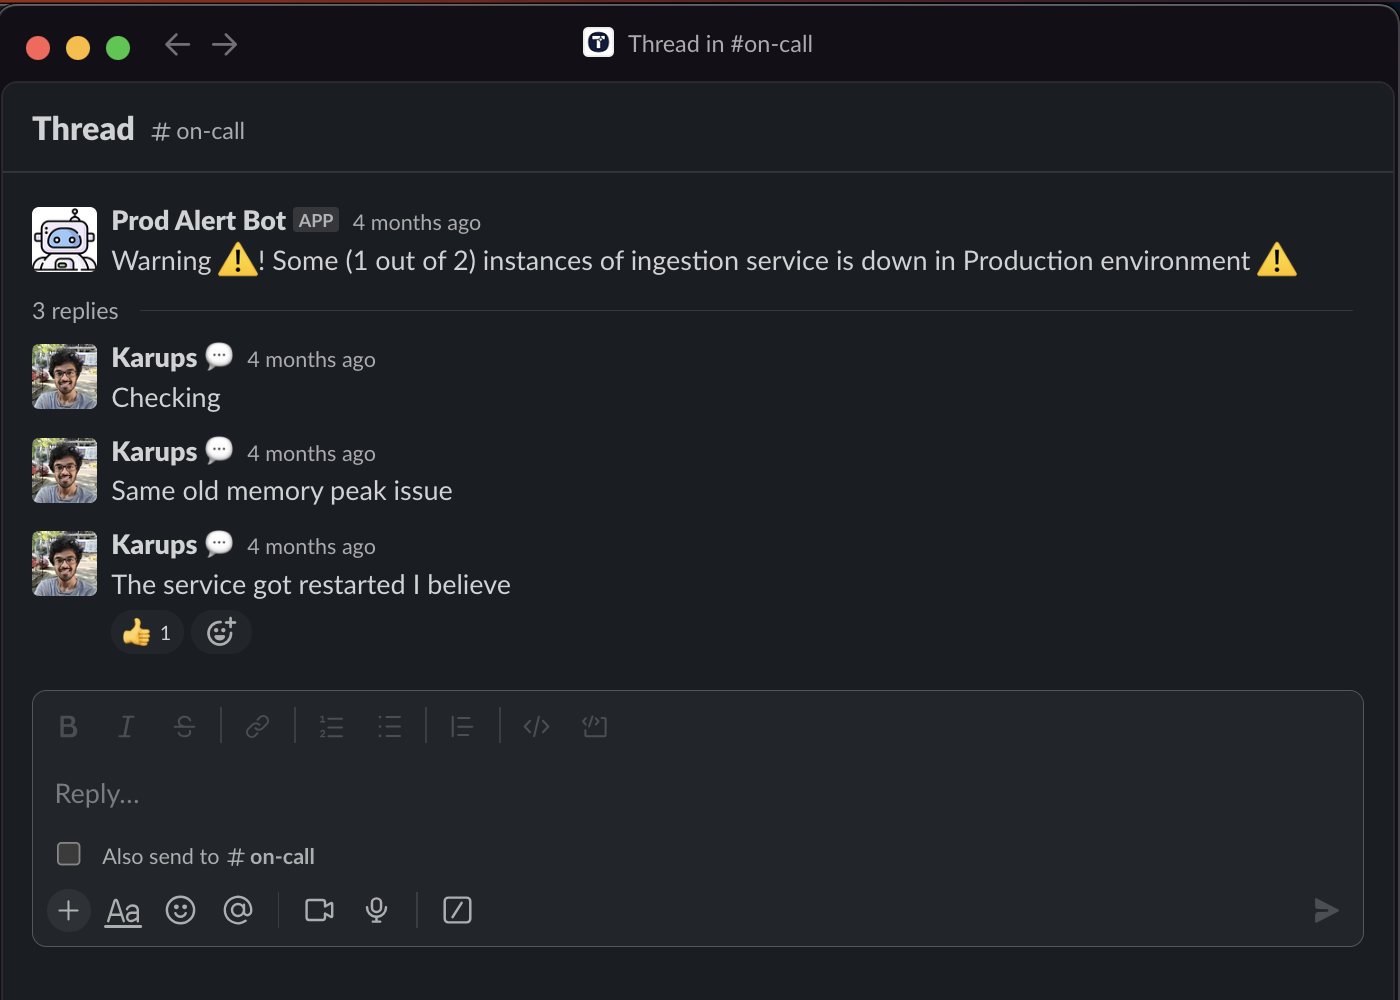

At this point, on May 17th morning, we had an idea 💡 of what was probably the issue. We thought we had found the issue but in reality, it wasn't clear then
So, what happened till May 17th, 2023? We had seen alerts that the ingestion service was down - multiple times, over a few days. We had seen ups and downs in the New Relic memory usage % graph 📈📉📈📉📈📉📈📉📈📉📈📉📈📉. We saw that the times when we got the alert and the New Relic graphs 📈📉 at those times, both had a clear pattern. Whenever the service down alert came, the service memory usage peaked at a value and then it went down. The same thing happened multiple times. It was like a sequence of triangular waves like the sine wave 🌊 📈📉📈📉 or cosine (cos) wave 🌊 📈📉📈📉
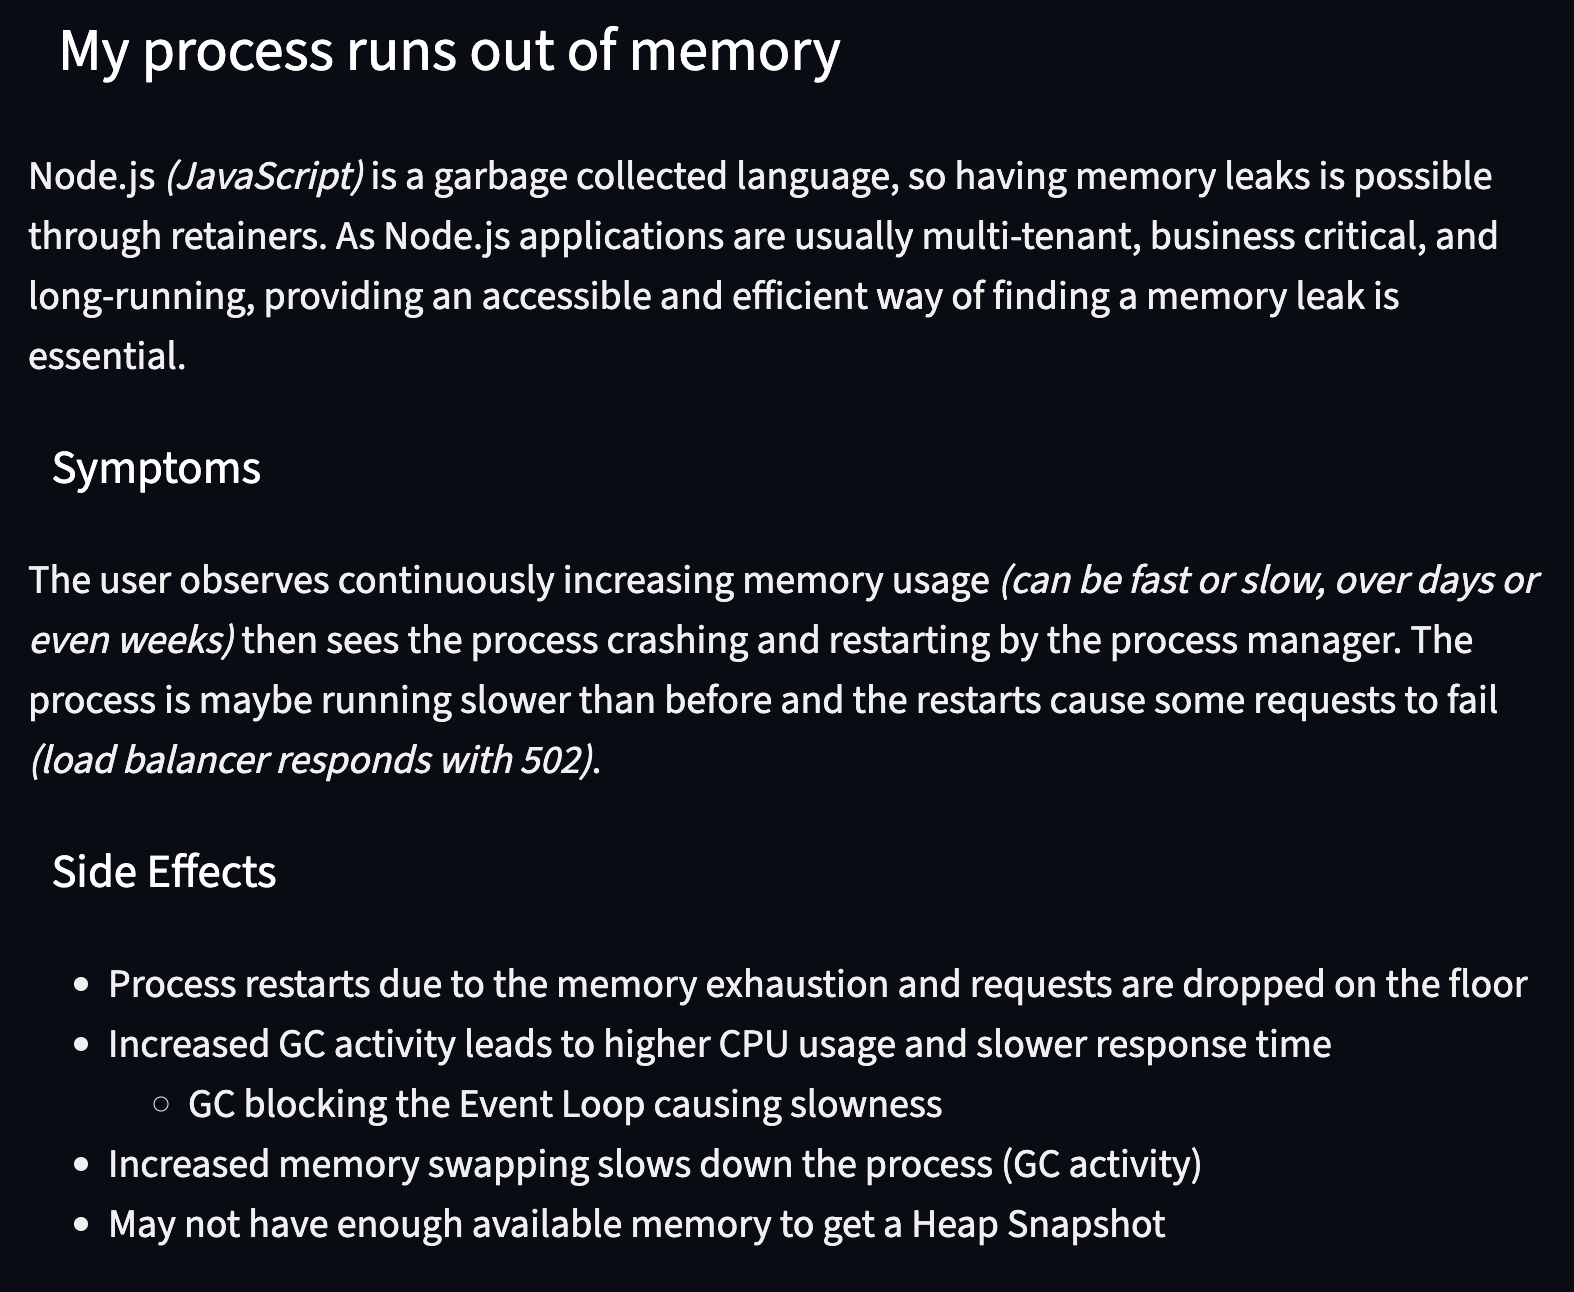
On checking the Node.js official website, it mentioned that Node.js can crash. We also noticed, by chance (😅), that the systemd service/unit running the Node.js server had uptime as a very low value, which meant that the service was started recently. It was restarted after a stop/crash
The official docs where we saw this information - https://nodejs.org/en/docs/guides/diagnostics/memory

We did memory profiling/heap profiling using Clinic.js HeapProfiler which, Hari, a colleague, mentioned.
Only after this heap profiling, we found out that there was something problematic regarding the logging library we were using, that was causing the memory issue for us
Here's what the data from the heap profiler looked like -
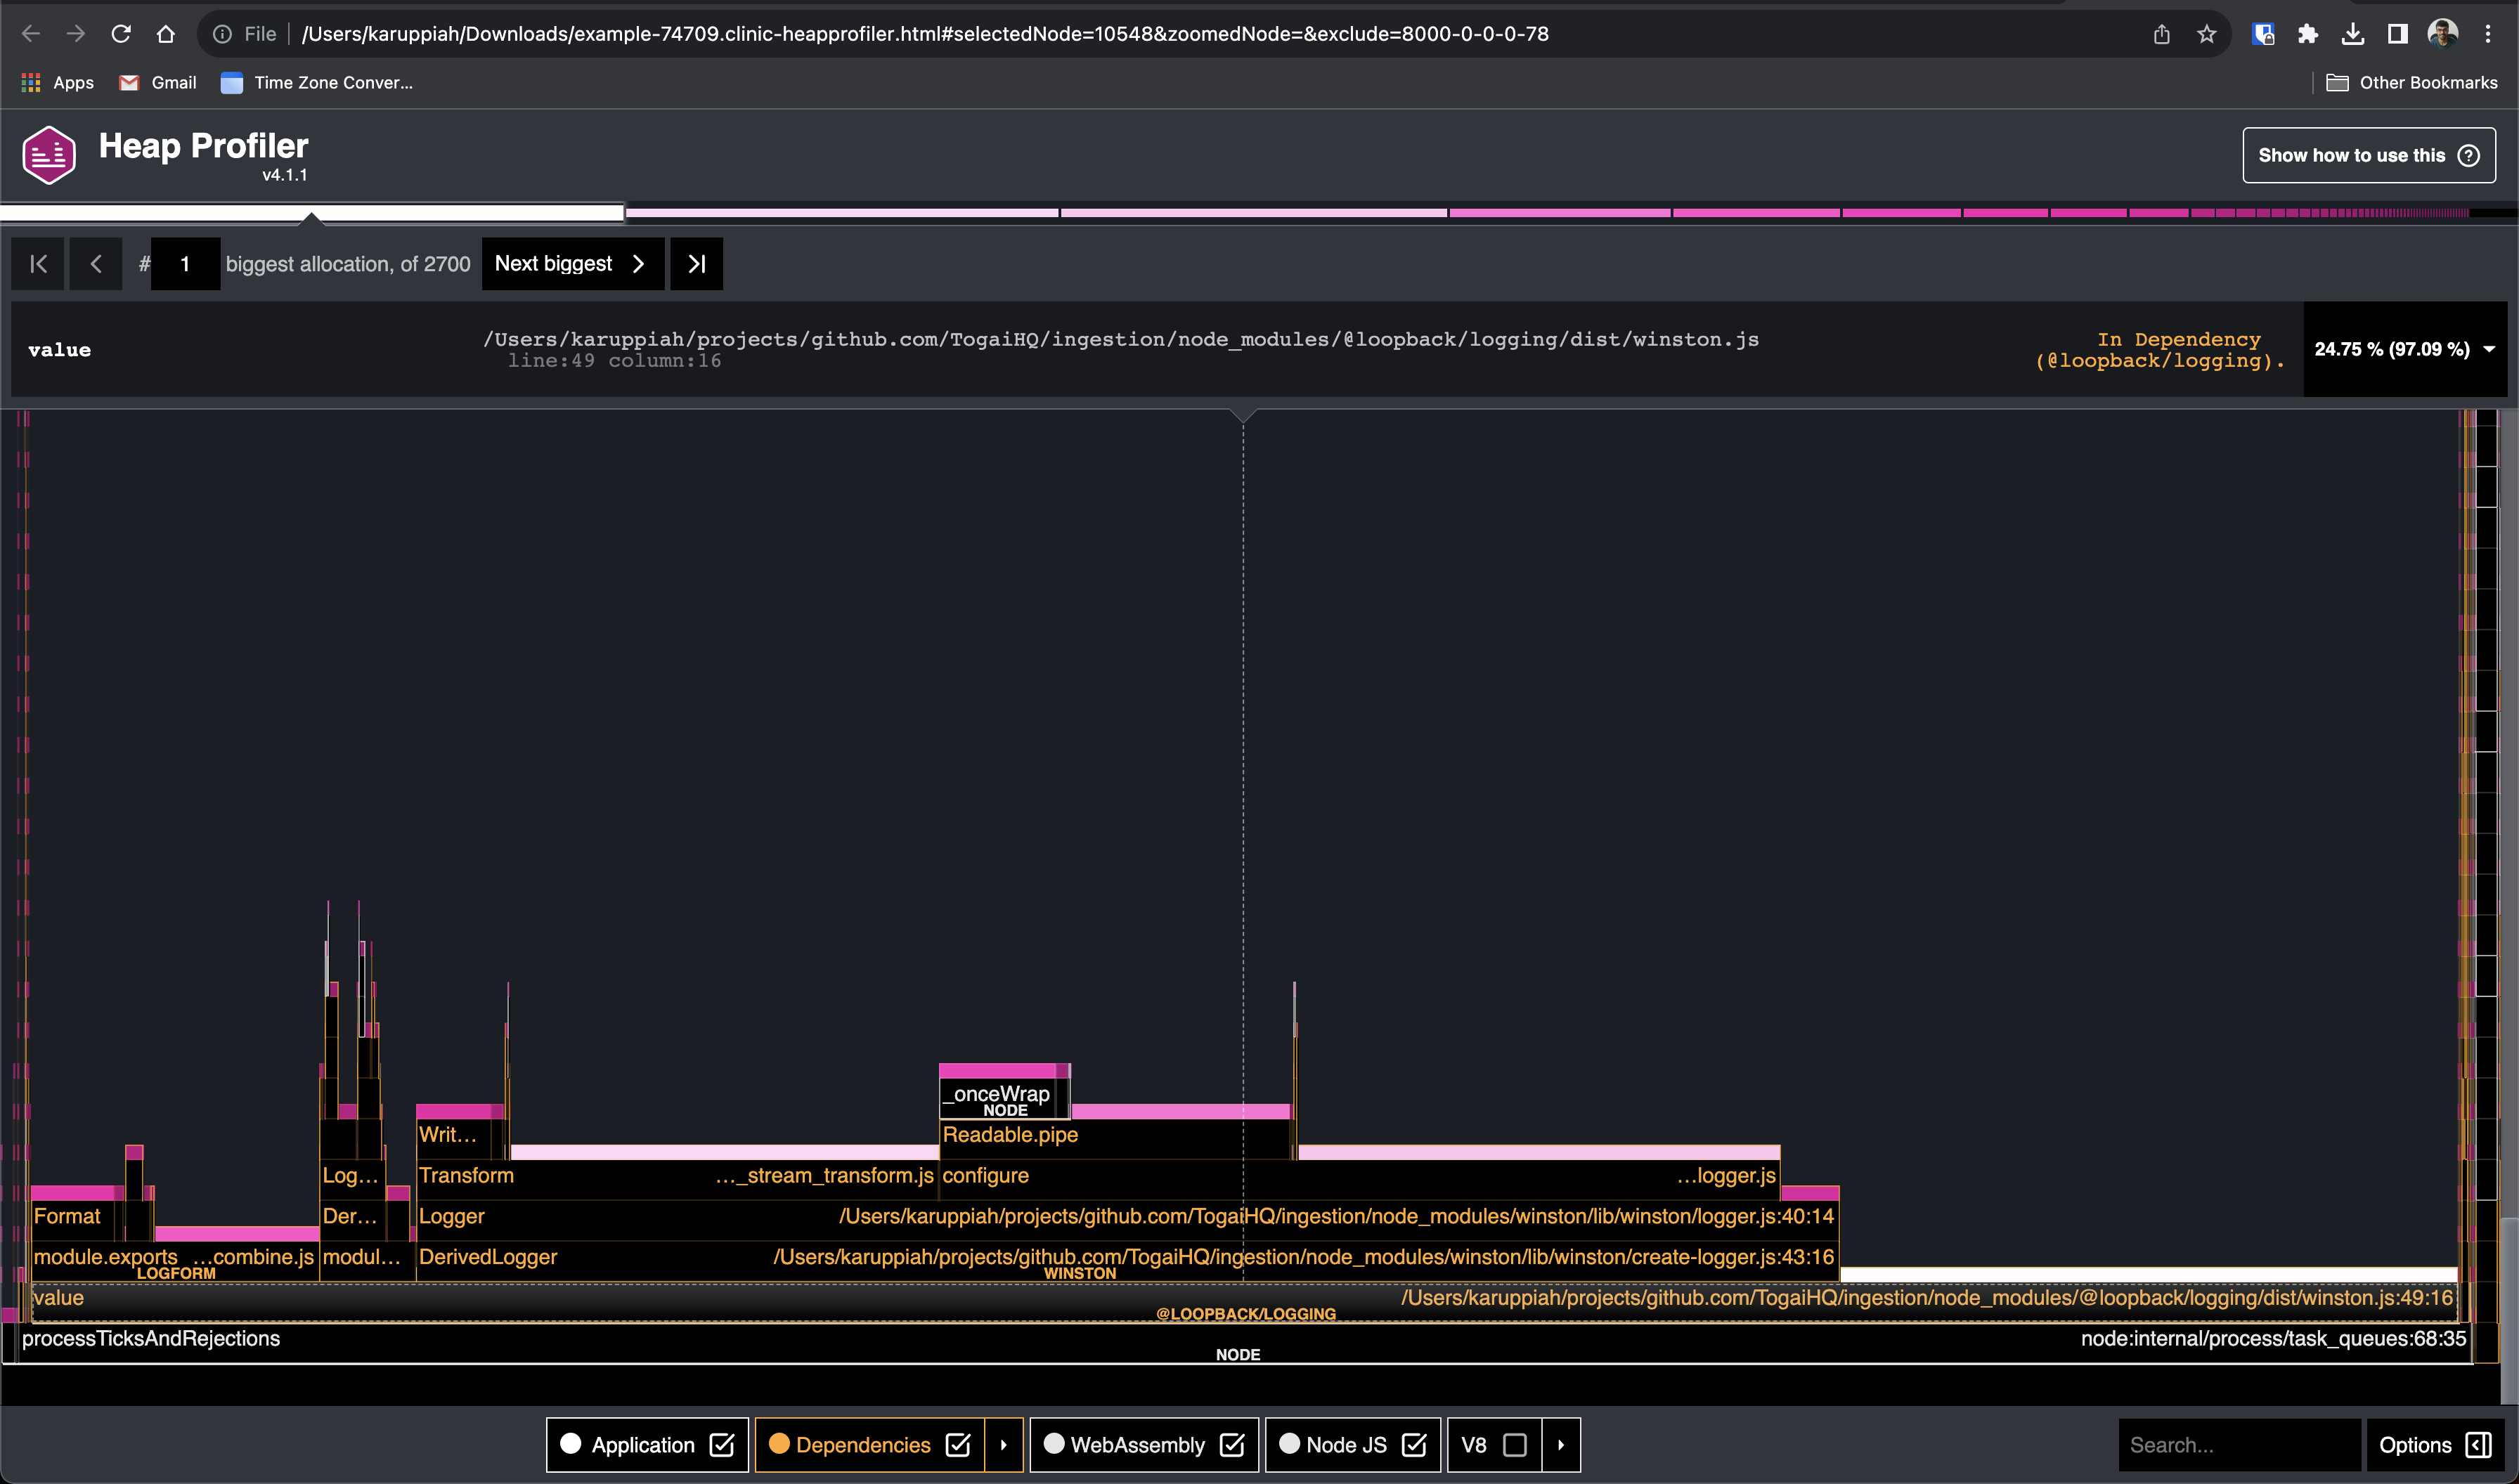
The HTML file for the above can be found here - https://ufile.io/v9hdzfap or here - https://github.com/karuppiah7890/blog-content/blob/main/debugging-and-fixing-memory-leak-in-nodejs-service/example-1-74709.clinic-heapprofiler.html
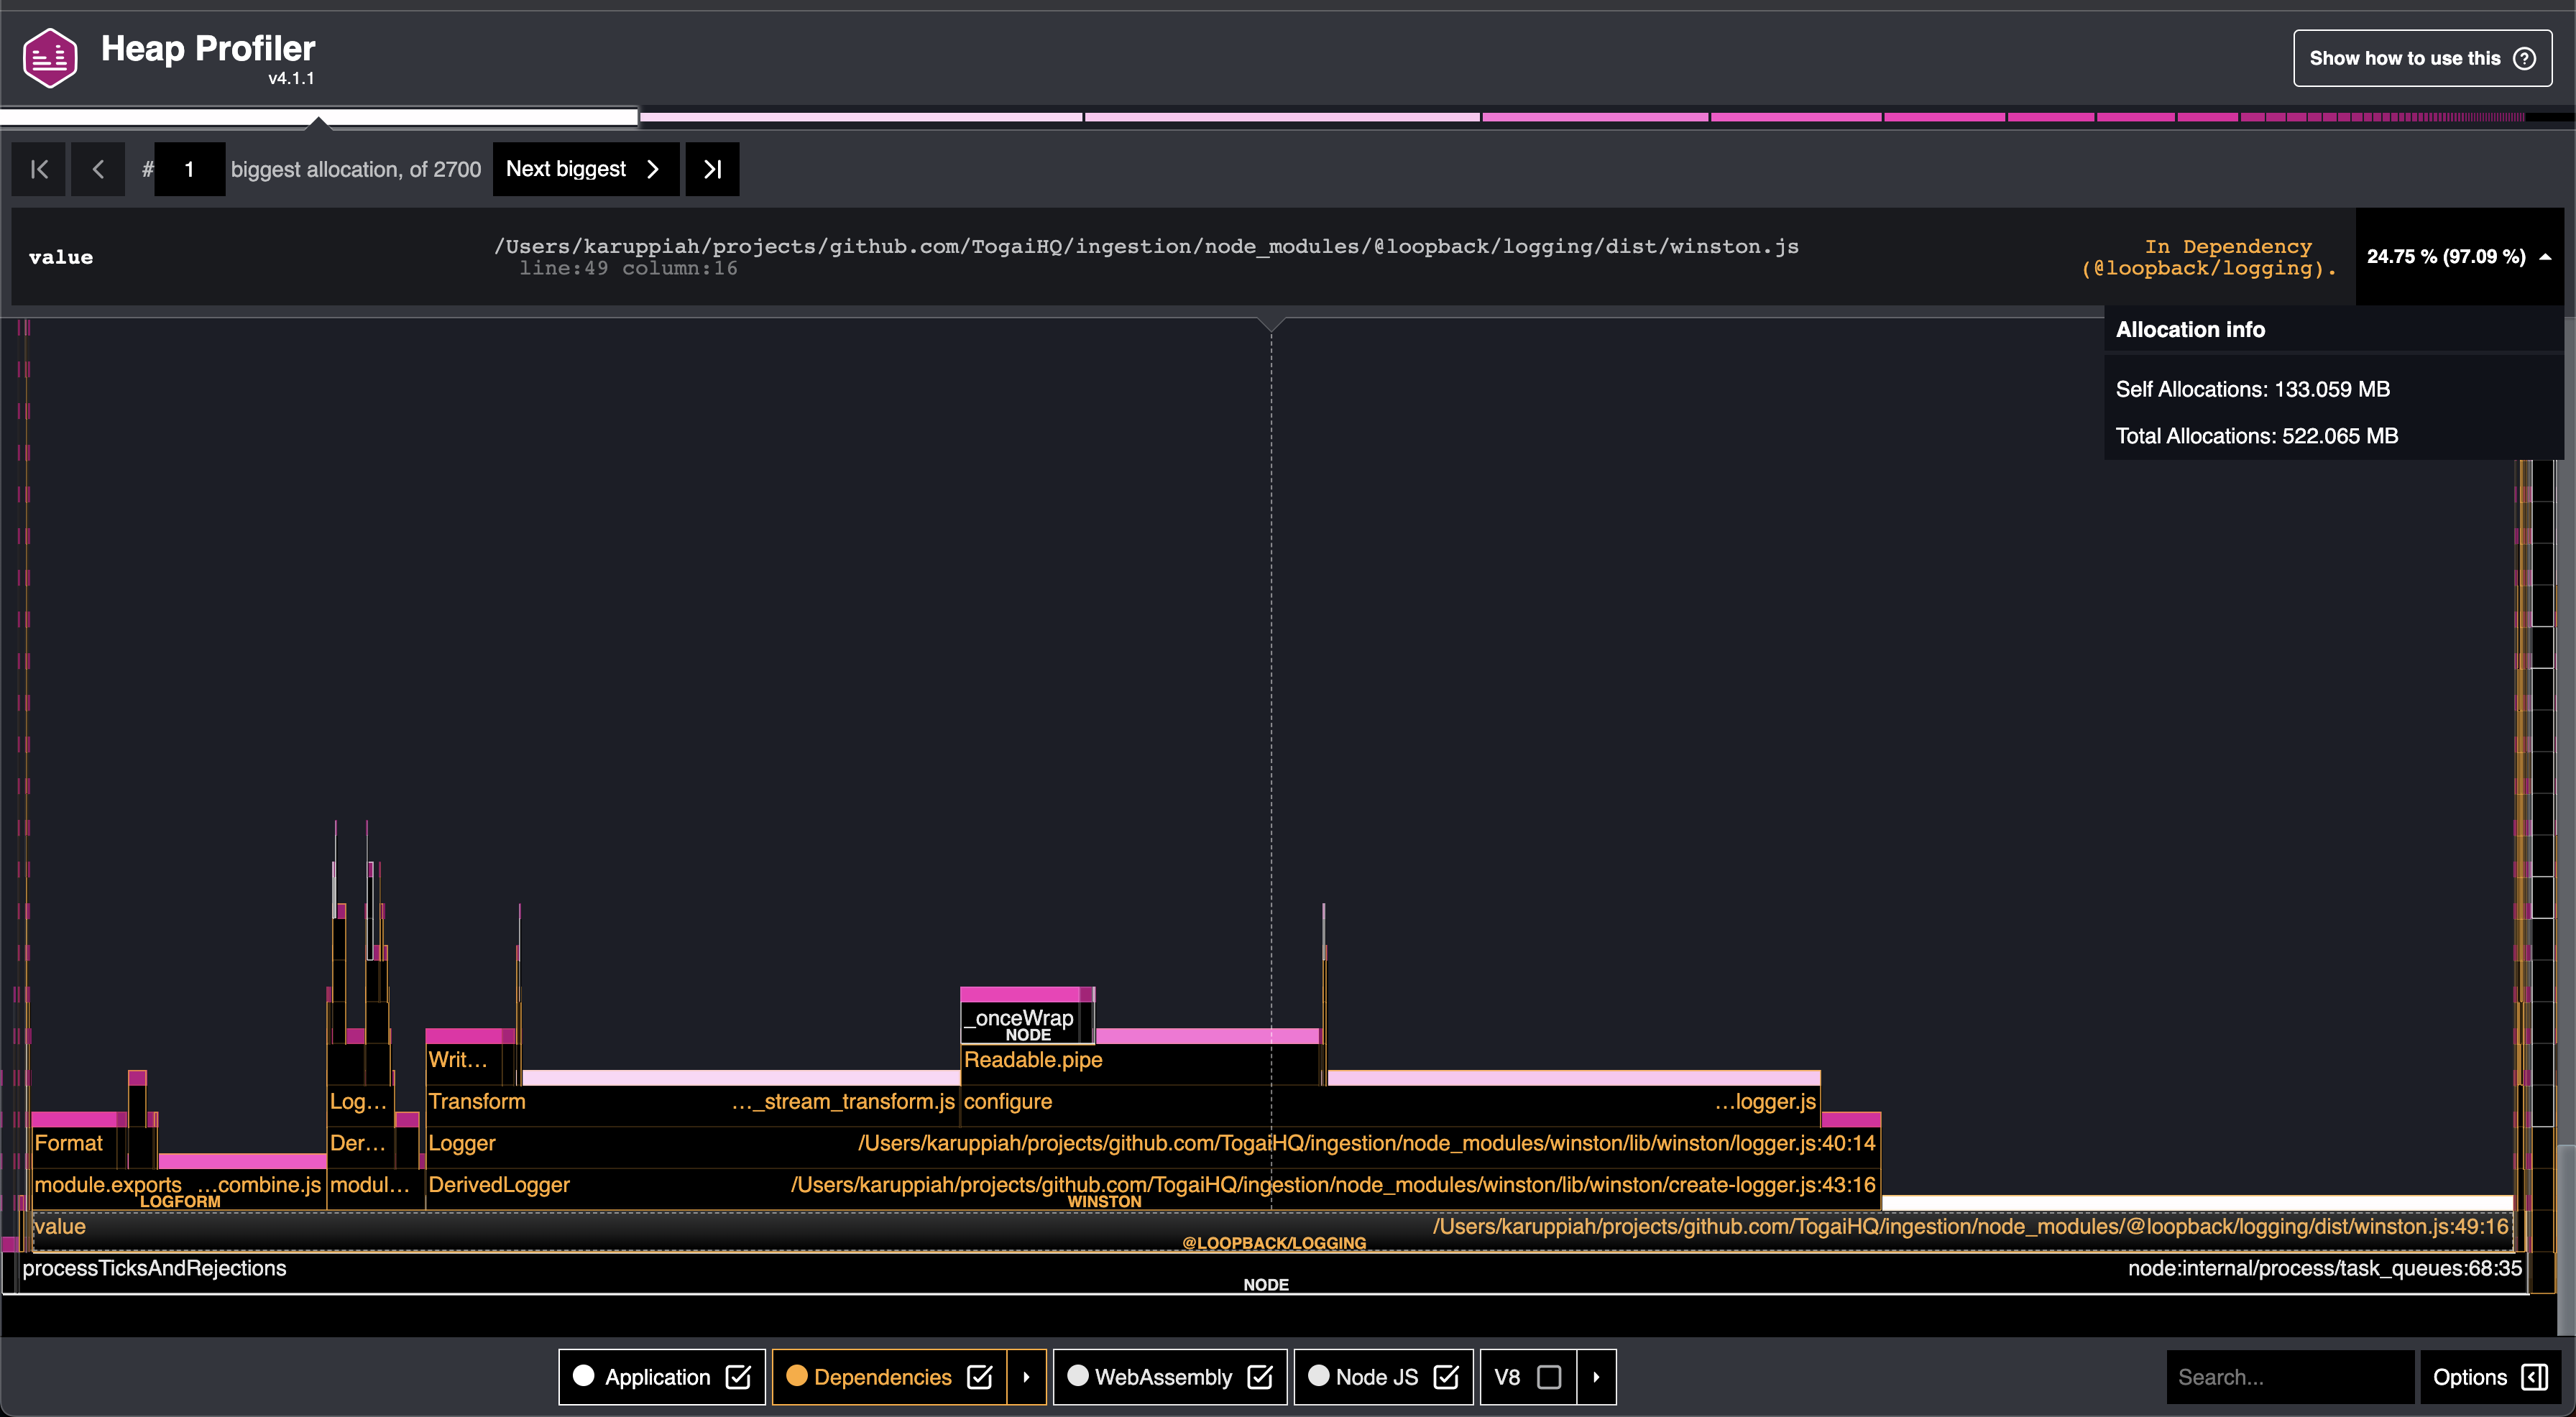
From the above image, you can notice the @loopback/logging library (or package) being mentioned in the graph
And it takes up the most amount of memory - look at the self-allocation(thr and total allocation data in the below image
I can't remember exactly what steps I took to get the above heap profile data. Let me try to give an idea though
One of the things that I did was - run the service locally and started hitting the event ingestion endpoint continuously, kind of like a load test - I think I was using curl and basic bash script - say using while loop
With this, I had some idea 💡 - that something with respect to logging was off / wrong. I didn't know exactly what or where though. As in, I couldn't backtrack the code I was seeing in the visual graph and the lines of code mentioned in the graph
I did see that we were using the Winston logging library through @loopback/logging package. Winston is a popular library in the JavaScript world, as noted by my seasoned colleague Hari. Hari was kind of hinting at that - Winston is probably not the problem as it's a good, popular and mature library
My plan was this then -
Next: Try using the latest version of winston as a replacement for @loopback/logging
Understand the following:
Where is the issue exactly happening at?
What is causing the issue to happen?
- Root cause
Who / what can be done to fix the issue?
- Put a bug fix somewhere? Use a different software? What to do?
I was trying to look into every data I could get my hands on. Some of the things I ensured -
I was running the production version of Ingestion service in my local. Why? It's because obviously, I need to reproduce the issue in my local machine with the same version as production and try to put a fix and check if the fix works and then do the same in production to fix the issue
I was running the latest version of Clinic.js tools
In local, I was noticing some logs that said this -
(node:21554) MaxListenersExceededWarning: Possible EventEmitter memory leak detected. 11 unpipe listeners added to [DailyRotateFile]. Use emitter.setMaxListeners() to increase limit
(Use `node --trace-warnings ...` to show where the warning was created)
(node:21554) MaxListenersExceededWarning: Possible EventEmitter memory leak detected. 11 error listeners added to [DailyRotateFile]. Use emitter.setMaxListeners() to increase limit
(node:21554) MaxListenersExceededWarning: Possible EventEmitter memory leak detected. 11 drain listeners added to [DailyRotateFile]. Use emitter.setMaxListeners() to increase limit
(node:21554) MaxListenersExceededWarning: Possible EventEmitter memory leak detected. 11 close listeners added to [DailyRotateFile]. Use emitter.setMaxListeners() to increase limit
(node:21554) MaxListenersExceededWarning: Possible EventEmitter memory leak detected. 11 finish listeners added to [DailyRotateFile]. Use emitter.setMaxListeners() to increase limit
It was clear that something was wrong. I was also not sure as to what this MaxListenersExceededWarning warning was and what the memory leak was - Possible EventEmitter memory leak detected. I tried to follow what the log said - Use emitter.setMaxListeners() to increase limit, but that just didn't help. Whenever I increased it, the warning still came up, with higher numbers
For example for 20 -
(node:29477) MaxListenersExceededWarning: Possible EventEmitter memory leak detected. 21 unpipe listeners added to [DailyRotateFile]. Use emitter.setMaxListeners() to increase limit
(Use `node --trace-warnings ...` to show where the warning was created)
(node:29477) MaxListenersExceededWarning: Possible EventEmitter memory leak detected. 21 error listeners added to [DailyRotateFile]. Use emitter.setMaxListeners() to increase limit
(node:29477) MaxListenersExceededWarning: Possible EventEmitter memory leak detected. 21 drain listeners added to [DailyRotateFile]. Use emitter.setMaxListeners() to increase limit
(node:29477) MaxListenersExceededWarning: Possible EventEmitter memory leak detected. 21 close listeners added to [DailyRotateFile]. Use emitter.setMaxListeners() to increase limit
(node:29477) MaxListenersExceededWarning: Possible EventEmitter memory leak detected. 21 finish listeners added to [DailyRotateFile]. Use emitter.setMaxListeners() to increase limit
and then for 20000 -
(node:29892) MaxListenersExceededWarning: Possible EventEmitter memory leak detected. 20001 unpipe listeners added to [DailyRotateFile]. Use emitter.setMaxListeners() to increase limit
(Use `node --trace-warnings ...` to show where the warning was created)
(node:29892) MaxListenersExceededWarning: Possible EventEmitter memory leak detected. 20001 error listeners added to [DailyRotateFile]. Use emitter.setMaxListeners() to increase limit
(node:29892) MaxListenersExceededWarning: Possible EventEmitter memory leak detected. 20001 drain listeners added to [DailyRotateFile]. Use emitter.setMaxListeners() to increase limit
(node:29892) MaxListenersExceededWarning: Possible EventEmitter memory leak detected. 20001 close listeners added to [DailyRotateFile]. Use emitter.setMaxListeners() to increase limit
(node:29892) MaxListenersExceededWarning: Possible EventEmitter memory leak detected. 20001 finish listeners added to [DailyRotateFile]. Use emitter.setMaxListeners() to increase limit
I had also become well versed in running load tests for ingestion service in my local. I moved away from basic tools like curl and started using tools recommended in Clinic.js tool documentation - For example autocannon
payload='{
    "event": {
        "attributes": [
            {
                "name": "message",
                "value": "100",
                "unit": "characters"
            }
        ],
        "dimensions": {
            "newKey": "New Value"
        },
        "schemaName": "dummy",
        "id": "something",
        "timestamp": "2022-06-15T07:30:35.123",
        "accountId": "1"
    }
}'
To just run a load test - that is, send many API calls, I just did this -
autocannon --headers accept=application/json \
  --headers content-type=application/json \
  --method POST http://localhost:3000/ingest \
  --body $payload
For running the heap profiler to find the heap profile data during such a load test, I ran this -
NODE_ENV=production clinic heapprofiler --autocannon [ --headers accept=application/json --headers content-type=application/json --method POST http://localhost:3000/ingest --body $payload --connections 100 --duration 100 ] -- node --trace-warnings dist/index.js
or for better readability -
NODE_ENV=production clinic heapprofiler \
  --autocannon [ --headers accept=application/json \
  --headers content-type=application/json \
  --method POST http://localhost:3000/ingest \
  --body $payload \
  --connections 100 \
  --duration 100 ] -- node --trace-warnings dist/index.js
I skimmed through multiple GitHub issues trying to understand what was wrong
A better thing I could have done - was try to backtrack and backtrace the heap profile visual data and code line and references I got to understand the flow of execution, what happened, what got called, and what was abnormal and why was it abnormal
One interesting thing - very later I was thinking that I could have reproduced the memory issue by just using the status endpoint instead of trying to send complex POST requests with JSON data with dummy event data. I thought this because the issue is something related to logs which is common for all endpoints - event ingestion, status etc. But later I realized that there was no memory issue occurring when just the status endpoint was being called
NODE_ENV=production clinic heapprofiler \
  --autocannon [ --headers accept=application/json \
  --headers content-type=application/json \
  --method GET http://localhost:3000/status \
  --connections 100 \
  --duration 100 ] -- node --trace-warnings dist/index.js
That was an interesting twist ;) However, the issue did occur for both ingestion endpoints - single event ingestion and batch events ingestion. The commands I used for experimenting with batch events ingestion were -
events_payload='{
    "events": [
        {
            "attributes": [
                {
                    "name": "message",
                    "value": "100",
                    "unit": "characters"
                }
            ],
            "dimensions": {
                "newKey": "New Value"
            },
            "schemaName": "dummy",
            "id": "something",
            "timestamp": "2022-06-15T07:30:35.123",
            "accountId": "1"
        }
    ]
}'
NODE_ENV=production clinic heapprofiler \
  --autocannon [ --headers accept=application/json \
  --headers content-type=application/json \
  --method POST http://localhost:3000/ingestBatch \
  --body $events_payload \
  --connections 100 \
  --duration 100 ] -- node --trace-warnings dist/index.js
I also used the clinic doctor command to use the Clinic.js Doctor tool which suggested I might have a memory leak issue in my program
Below is how I ran the clinic doctor command -
NODE_ENV=production clinic doctor \
  --autocannon [ --headers accept=application/json \
  --headers content-type=application/json \
  --method POST http://localhost:3000/ingestBatch \
  --body $events_payload \
  --connections 100 \
  --duration 100 ] -- node --trace-warnings dist/index.js
Yeah, just replace the word heapprofiler with doctor and you are done :) To see how the output of clinic doctor command looks like, just scroll below to look. Here's an example - https://github.com/karuppiah7890/blog-content/blob/main/debugging-and-fixing-memory-leak-in-nodejs-service/35852.clinic-doctor.html
Below is the list of URLs that I kept digging through to find out what the memory problem is
https://github.com/loopbackio/loopback-next/issues/4545
https://duckduckgo.com/?q=lb-tsc+not+building&atb=v388-2&ia=web
https://github.com/winstonjs/winston-daily-rotate-file/issues?q=is%3Aissu+is%3Aclosed+
https://www.npmjs.com/search?q=winston%20transport
https://www.npmjs.com/package/winston-transport?activeTab=readme
https://github.com/winstonjs?q=&type=all&language=&sort=
https://github.com/winstonjs/winston-daily-rotate-file
https://docs.togai.com/reference/ingestbatch
https://duckduckgo.com/?q=npm+carrot+vs+tilde&atb=v388-2&ia=web
https://duckduckgo.com/?q=find+root+cause+for+systemd+service+to+restart&atb=v388-2&ia=web
https://www.npmjs.com/package/winston
https://github.com/winstonjs/winston/
https://github.com/winstonjs/winston/issues
https://github.com/winstonjs/winston/issues/2065
https://github.com/winstonjs/winston/issues/2247
https://github.com/winstonjs/winston/issues/1334
https://github.com/ChainSafe/lodestar/issues/5529
https://github.com/ChainSafe/lodestar/pull/5537
https://github.com/ChainSafe/lodestar/pull/5537/files
https://github.com/winstonjs/winston/issues?q=is%3Aissue+is%3Aopen+memory+leak
https://github.com/winstonjs/winston/issues/2100
https://www.npmjs.com/package/readable-stream
https://github.com/nodejs/readable-stream
https://github.com/nodejs/readable-stream/issues/
https://github.com/nodejs/readable-stream/issues?q=is%3Aissue+memory+leak+is%3Aclosed
https://github.com/nodejs/readable-stream/issues/43
https://github.com/nodejs/readable-stream/issues/322
Finally, I was trying to upgrade some package versions in the package-lock.json file - I can't recall exactly which ones, I think I was trying it wherever possible - for winston package and related packages, for readable-stream package, for @loopback/logging package - which required me to update the version for almost all things related to loopback framework
Nothing worked. None of them worked.
This was the second time I was dealing with this ingestion service issue. The first time, we let it go when the alerts stopped coming. Later, it started coming back and that's when we did more digging and tried to understand more about the heap profile data.
This time we were getting alerts for high memory usage and also service down alerts
This time I d
At this point, my CTO was like - "If logging library is the issue, let's just change it. If that's an easier thing to do, let's do that, instead of trying to find out the root cause here". And it made sense. This was the initial idea 💡 I had long ago but I shot it down when Hari said Winston is a popular logging library
Now comes the craziest part. When I started looking at the code, written with loopback framework and tried to understand what was going on, somehow I stumbled upon a few things, like BindingScope.TRANSIENT and read about it in the code docs and kind of understood what was the problem and what was going on and how Winston or loopback or @loopback/logging were not the culprit and that we, the developers of the service, were the biggest culprits 😅
As usual! It's the developers at fault! Why am I not surprised? 🤷♂️🤷 I just didn't see it coming, and didn't debug well, or else I would have cracked it long ago. I just brushed off almost everything as some sort of magic, like I do in Java and similar languages where there are frameworks and magic 🪄 . If I had tried to understand the flow of execution and the inner workings of loopback framework and how readable-stream, EventEmitter etc. works, I would have nailed this on the head. But I wasn't willing to put in that time - and instead, spent all the time running in some random direction, trying to debug and figure out this issue. This whole thing literally took me 3 months to get to the root cause and fix it. 3 months! From April end to July end - May, June, July. I wasn't actively working on it, but I was working on it at times and working on it more often in July, among other things
So, what was the problem? The problem was that - we were creating multiple instances of the WinstonLogger object like this -
  @inject(LoggingBindings.WINSTON_LOGGER)
  private logger: WinstonLogger;
We were doing this inside the event ingestion controller and inside the event ingestion service too. So, how did we really end up creating multiple instances of WinstonLogger - by creating a new instance of the event ingestion service class object for every new request. I think the Loopback framework also creates a new instance of an event ingestion controller class object for every new request - which I think is unmodifiable - I think I tried to have exactly one controller object for all requests but that didn't work. You could try it out!
Anyways, so, for every request - we were creating an event ingestion controller class object, an event ingestion service class object, and two WinstonLogger class objects - one at the controller level and another at the service level. Imagine what would happen when more than a few requests hit the ingestion service. Yes, exactly - too many WinstonLogger objects and also event ingestion service objects - unnecessarily that too! I noticed warnings of memory leaks when running tests for these controllers! That's just a handful of requests - like some 5 or 10 requests in total. Imagine what would happen when 3K to 3.5K requests per minute hit the service. Yup. That's right. Also, at this point, I noticed that the Node.js service was crashing when I checked the journald logs (for systemd services) using sudo journalctl -xe | grep node only to see that the Node.js service was crashing and the reason was most probably because of this memory leak issue - where we created too many objects unnecessarily where we could just use exactly one object for the service and the logger.
All this while, till I found the root cause and other details, I was wondering why the Node.js process went down and how. I was wondering if it was the Kernel Out Of Memory (OOM) Killer which kills processes if the available memory is too low - but in our case, we had more than 1 GB of free RAM available. Later I validated my assumptions and found out that it wasn't the Linux OOM Killer by checking kernel logs in journalctl, while doing this I had an idea 💡 (yeah, so late!) to check Node.js service logs too. I then started checking Node.js service logs with journalctl and found out crash logs, with some GC data etc. and how maximum heap memory was reached and that it's crashing. This finally answered what happened to the Node.js process, and why it went down. The answer gave me some relief
Node.js service crash logs from journald using journalctl -
$ sudo journalctl -xe | grep node
Jul 28 08:35:12 app-server-2 ingestion-server[30406]: 1: 0xb0a870 node::Abort() [/bin/node]
Jul 28 08:35:12 app-server-2 ingestion-server[30406]: 2: 0xa1c193 node::FatalError(char const*, char const*) [/bin/node]
Jul 28 08:35:12 app-server-2 ingestion-server[30406]: 3: 0xcf9a7e v8::Utils::ReportOOMFailure(v8::internal::Isolate*, char const*, bool) [/bin/node]
Jul 28 08:35:12 app-server-2 ingestion-server[30406]: 4: 0xcf9df7 v8::internal::V8::FatalProcessOutOfMemory(v8::internal::Isolate*, char const*, bool) [/bin/node]
Jul 28 08:35:12 app-server-2 ingestion-server[30406]: 5: 0xeb1675  [/bin/node]
Jul 28 08:35:12 app-server-2 ingestion-server[30406]: 6: 0xeb2156  [/bin/node]
Jul 28 08:35:12 app-server-2 ingestion-server[30406]: 7: 0xec067e  [/bin/node]
Jul 28 08:35:12 app-server-2 ingestion-server[30406]: 8: 0xec10c0 v8::internal::Heap::CollectGarbage(v8::internal::AllocationSpace, v8::internal::GarbageCollectionReason, v8::GCCallbackFlags) [/bin/node]
Jul 28 08:35:12 app-server-2 ingestion-server[30406]: 9: 0xf24504 v8::internal::ScavengeJob::Task::RunInternal() [/bin/node]
Jul 28 08:35:12 app-server-2 ingestion-server[30406]: 10: 0xdb7beb non-virtual thunk to v8::internal::CancelableTask::Run() [/bin/node]
Jul 28 08:35:12 app-server-2 ingestion-server[30406]: 11: 0xb786b4 node::PerIsolatePlatformData::RunForegroundTask(std::unique_ptr<v8::Task, std::default_delete<v8::Task> >) [/bin/node]
Jul 28 08:35:12 app-server-2 ingestion-server[30406]: 12: 0xb7a519 node::PerIsolatePlatformData::FlushForegroundTasksInternal() [/bin/node]
Jul 28 08:35:12 app-server-2 ingestion-server[30406]: 13: 0x1565556  [/bin/node]
Jul 28 08:35:12 app-server-2 ingestion-server[30406]: 14: 0x1577c84  [/bin/node]
Jul 28 08:35:12 app-server-2 ingestion-server[30406]: 15: 0x1565ea8 uv_run [/bin/node]
Jul 28 08:35:12 app-server-2 ingestion-server[30406]: 16: 0xa43dd5 node::SpinEventLoop(node::Environment*) [/bin/node]
Jul 28 08:35:12 app-server-2 ingestion-server[30406]: 17: 0xb4ca16 node::NodeMainInstance::Run(node::EnvSerializeInfo const*) [/bin/node]
Jul 28 08:35:12 app-server-2 ingestion-server[30406]: 18: 0xace5a2 node::Start(int, char**) [/bin/node]
Jul 28 08:35:12 app-server-2 ingestion-server[30406]: 20: 0xa4067c  [/bin/node]
Jul 28 08:35:21 app-server-2 ingestion-server[8000]: (node:8020) MaxListenersExceededWarning: Possible EventEmitter memory leak detected. 11 unpipe listeners added to [DailyRotateFile]. Use emitter.setMaxListeners() to increase limit
Jul 28 08:35:21 app-server-2 ingestion-server[8000]: (Use `node --trace-warnings ...` to show where the warning was created)
Jul 28 08:35:21 app-server-2 ingestion-server[8000]: (node:8020) MaxListenersExceededWarning: Possible EventEmitter memory leak detected. 11 error listeners added to [DailyRotateFile]. Use emitter.setMaxListeners() to increase limit
Jul 28 08:35:21 app-server-2 ingestion-server[8000]: (node:8020) MaxListenersExceededWarning: Possible EventEmitter memory leak detected. 11 drain listeners added to [DailyRotateFile]. Use emitter.setMaxListeners() to increase limit
Jul 28 08:35:21 app-server-2 ingestion-server[8000]: (node:8020) MaxListenersExceededWarning: Possible EventEmitter memory leak detected. 11 close listeners added to [DailyRotateFile]. Use emitter.setMaxListeners() to increase limit
Jul 28 08:35:21 app-server-2 ingestion-server[8000]: (node:8020) MaxListenersExceededWarning: Possible EventEmitter memory leak detected. 11 finish listeners added to [DailyRotateFile]. Use emitter.setMaxListeners() to increase limit
Jul 28 09:37:57 app-server-2 ingestion-server[8000]: 1: 0xb0a870 node::Abort() [/bin/node]
Jul 28 09:37:57 app-server-2 ingestion-server[8000]: 2: 0xa1c193 node::FatalError(char const*, char const*) [/bin/nod]
Jul 28 09:37:57 app-server-2 ingestion-server[8000]: 3: 0xcf9a7e v8::Utils::ReportOOMFailure(v8::internal::Isolate*, char const*, bool) [/bin/node]
Jul 28 09:37:57 app-server-2 ingestion-server[8000]: 4: 0xcf9df7 v8::internal::V8::FatalProcessOutOfMemory(v8::internal::Isolate*, char const*, bool) [/bin/node]
Jul 28 09:37:57 app-server-2 ingestion-server[8000]: 5: 0xeb1675  [/bin/node]
Jul 28 09:37:57 app-server-2 ingestion-server[8000]: 6: 0xeb2156  [/bin/node]
Jul 28 09:37:57 app-server-2 ingestion-server[8000]: 7: 0xec067e  [/bin/node]
Jul 28 09:37:57 app-server-2 ingestion-server[8000]: 8: 0xec10c0 v8::internal::Heap::CollectGarbage(v8::internal::AllocationSpace, v8::internal::GarbageCollectionReason, v8::GCCallbackFlags) [/bin/node]
Jul 28 09:37:57 app-server-2 ingestion-server[8000]: 9: 0xf24504 v8::internal::ScavengeJob::Task::RunInternal() [/binnode]
Jul 28 09:37:57 app-server-2 ingestion-server[8000]: 10: 0xdb7beb non-virtual thunk to v8::internal::CancelableTask::Run() [/bin/node]
Jul 28 09:37:57 app-server-2 ingestion-server[8000]: 11: 0xb786b4 node::PerIsolatePlatformData::RunForegroundTask(std::unique_ptr<v8::Task, std::default_delete<v8::Task> >) [/bin/node]
Jul 28 09:37:57 app-server-2 ingestion-server[8000]: 12: 0xb7a519 node::PerIsolatePlatformData::FlushForegroundTasksInternal() [/bin/node]
Jul 28 09:37:57 app-server-2 ingestion-server[8000]: 13: 0x1565556  [/bin/node]
Jul 28 09:37:57 app-server-2 ingestion-server[8000]: 14: 0x1577c84  [/bin/node]
Jul 28 09:37:57 app-server-2 ingestion-server[8000]: 15: 0x1565ea8 uv_run [/bin/node]
Jul 28 09:37:57 app-server-2 ingestion-server[8000]: 16: 0xa43dd5 node::SpinEventLoop(node::Environment*) [/bin/node]
Jul 28 09:37:57 app-server-2 ingestion-server[8000]: 17: 0xb4ca16 node::NodeMainInstance::Run(node::EnvSerializeInfo const*) [/bin/node]
Jul 28 09:37:57 app-server-2 ingestion-server[8000]: 18: 0xace5a2 node::Start(int, char**) [/bin/node]
Jul 28 09:37:57 app-server-2 ingestion-server[8000]: 20: 0xa4067c  [/bin/node]
Jul 28 09:38:08 app-server-2 ingestion-server[17332]: (node:17352) MaxListenersExceededWarning: Possible EventEmitter memory leak detected. 11 unpipe listeners added to [DailyRotateFile]. Use emitter.setMaxListeners() to increase limit
Jul 28 09:38:08 app-server-2 ingestion-server[17332]: (Use `node --trace-warnings ...` to show where the warning was created)
Jul 28 09:38:08 app-server-2 ingestion-server[17332]: (node:17352) MaxListenersExceededWarning: Possible EventEmitter memory leak detected. 11 error listeners added to [DailyRotateFile]. Use emitter.setMaxListeners() to increase limit
Jul 28 09:38:08 app-server-2 ingestion-server[17332]: (node:17352) MaxListenersExceededWarning: Possible EventEmitter memory leak detected. 11 drain listeners added to [DailyRotateFile]. Use emitter.setMaxListeners() to increase limit
Jul 28 09:38:08 app-server-2 ingestion-server[17332]: (node:17352) MaxListenersExceededWarning: Possible EventEmitter memory leak detected. 11 close listeners added to [DailyRotateFile]. Use emitter.setMaxListeners() to increase limit
Jul 28 09:38:08 app-server-2 ingestion-server[17332]: (node:17352) MaxListenersExceededWarning: Possible EventEmitter memory leak detected. 11 finish listeners added to [DailyRotateFile]. Use emitter.setMaxListeners() to increase limit

$ date
Fri Jul 28 10:14:01 UTC 2023

$ systemctl status ingestion.service
● ingestion.service - Ingestion Service
   Loaded: loaded (/etc/systemd/system/ingestion.service; enabled; vendor preset: disabled)
   Active: active (running) since Fri 2023-07-28 09:37:57 UTC; 36min ago
  Process: 17332 ExecStart=/data/ingestion/shared/ingestion-server start (code=exited, status=0/SUCCESS)
 Main PID: 17352 (node)
   Memory: 1.5G
   CGroup: /system.slice/ingestion.service
           └─17352 /bin/node dist/index.js
About the memory leak issue, in many GitHub issues, people had mentioned how one should not instantiate too many instances of the Winston transport, like, to not use it multiple times or something and that it is a problem to do so
I deployed the fix to reduce the creation of Winston Logger objects by using singleton objects for the logger and the service object. I was able to load test and see that there was no memory issue - using both the Clinic.js doctor tool and heap profiler tool
Some things that came as an afterthought - maybe load testing the service and running a heap dump and visualizing the heap dump and the items/data in it would have shown what was using up the heap memory - the Winston Logger objects. I did this with a dummy service in my local. Scroll below to see more
So, still, some questions off the top of my head are - was this a memory leak issue? That is, were Logger instances created but not deleted? That's what a memory leak issue is. And that's why the memory leak happened? Not sure. Or is it just that there were a lot of logger instances that got created and the GC happened less often, hence leaving a lot of loggers alive and hanging around in the heap and causing high memory usage - causing the Node.js process to crash? 💥 Not sure. I did do a heap dump/heap snapshot 🫰 in a dummy service in my local and noticed a lot of Winston logger-related objects. Not sure if they were getting garbage collected or not. Maybe the speed and level at which garbage 🗑️ collection wasn't good enough - mostly because the code is bad 😅 and hence caused high memory usage - peaking at around 2GB RAM in our production environment, causing it to crash
Even with all these questions - I was doing testing on my local machine. Of course, the production environment could have been facing a different problem too, I'm realizing it now and I have to come up with solutions for validating the assumption that I was able to reproduce the high memory usage problem. I guess we just have to inspect the same data in production - do heap profiling while production traffic is coming, do a heap dump and try to understand what's happening, what's going on and then put the fix and check if the issue still exists
Below is a sample code with sample commands to reproduce and show the issue in a dummy service repo with the same issue
git clone https://github.com/karuppiah7890/dummy-loopback-app.git

cd dummy-loopback-app

# Use Node v16.x.y, like v16.16.0
npm install

npm run rebuild

npm install -g clinic autocannon

NODE_ENV=production clinic doctor \
  --autocannon [ --headers accept=application/json \
  --headers content-type=application/json \
  --method GET http://localhost:3000/ping  \
  --connections 100 \
  --duration 100 ] -- node --trace-warnings dist/index.js

NODE_ENV=production clinic heapprofiler \
  --autocannon [ --headers accept=application/json \
  --headers content-type=application/json \
  --method GET http://localhost:3000/ping  \
  --connections 100 \
  --duration 100 ] -- node --trace-warnings dist/index.js
Below is how the doctor tool's output would look like - as an HTML web page -
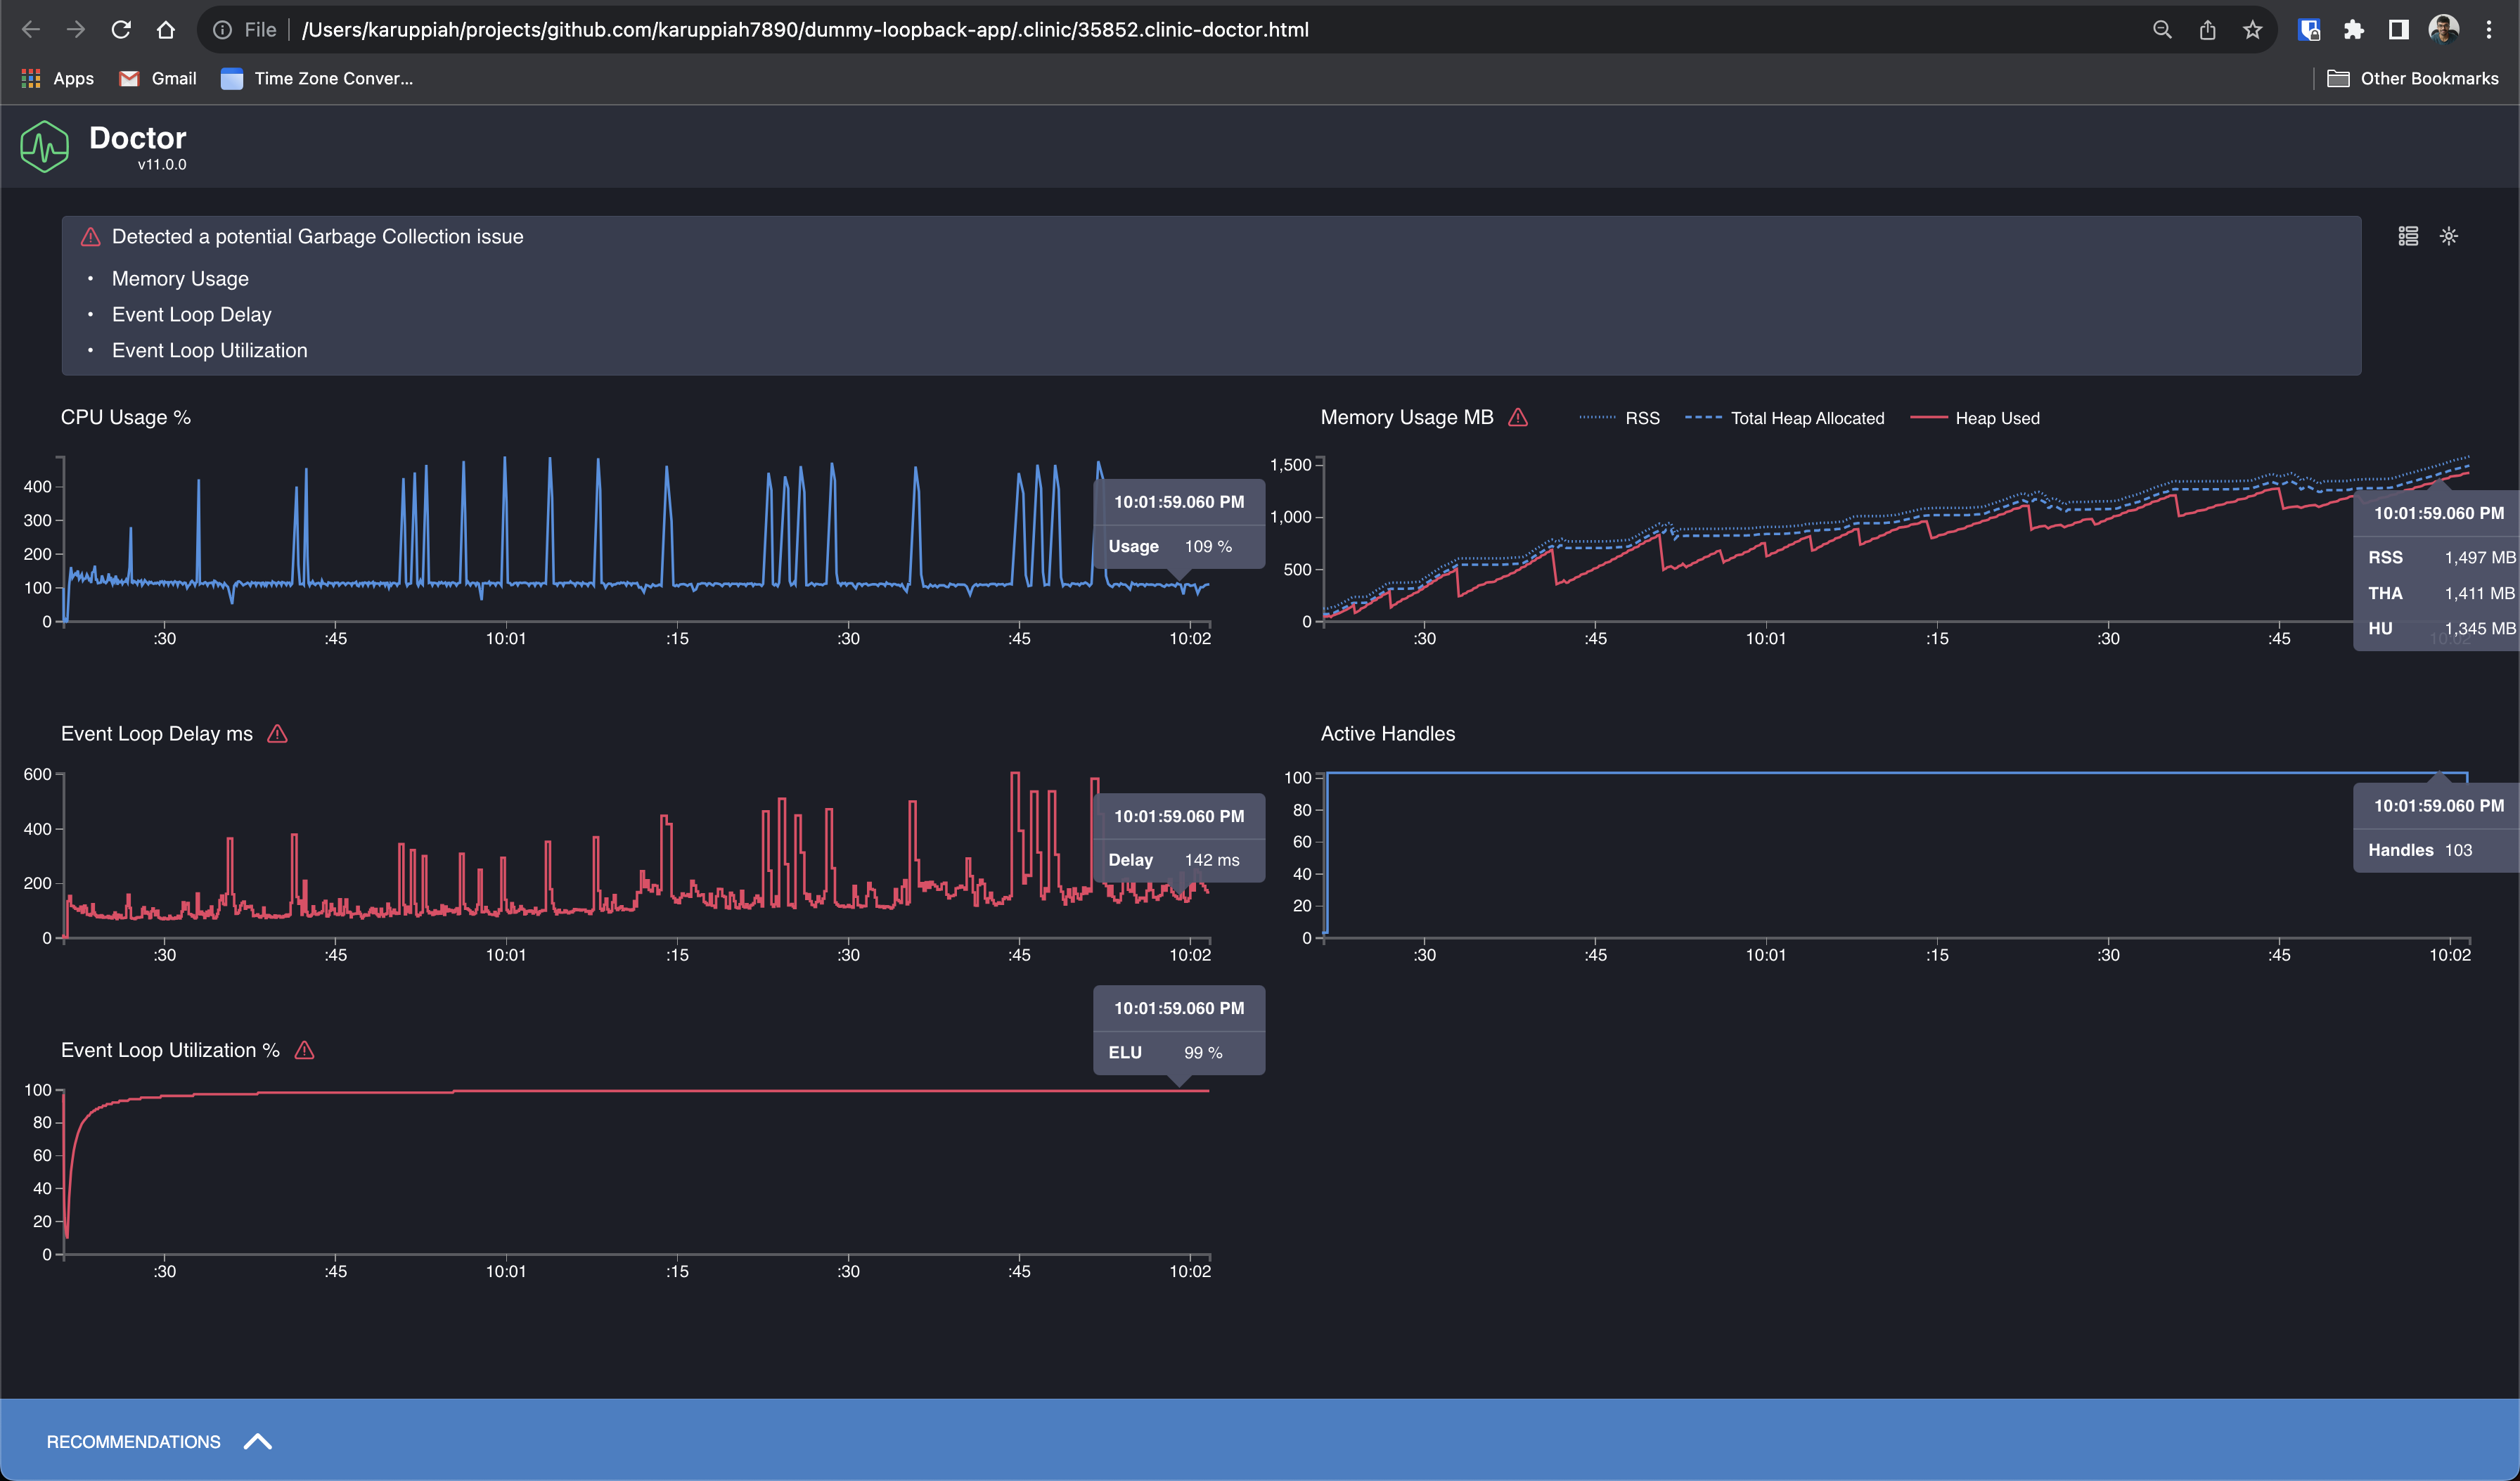
Below are the recommendations
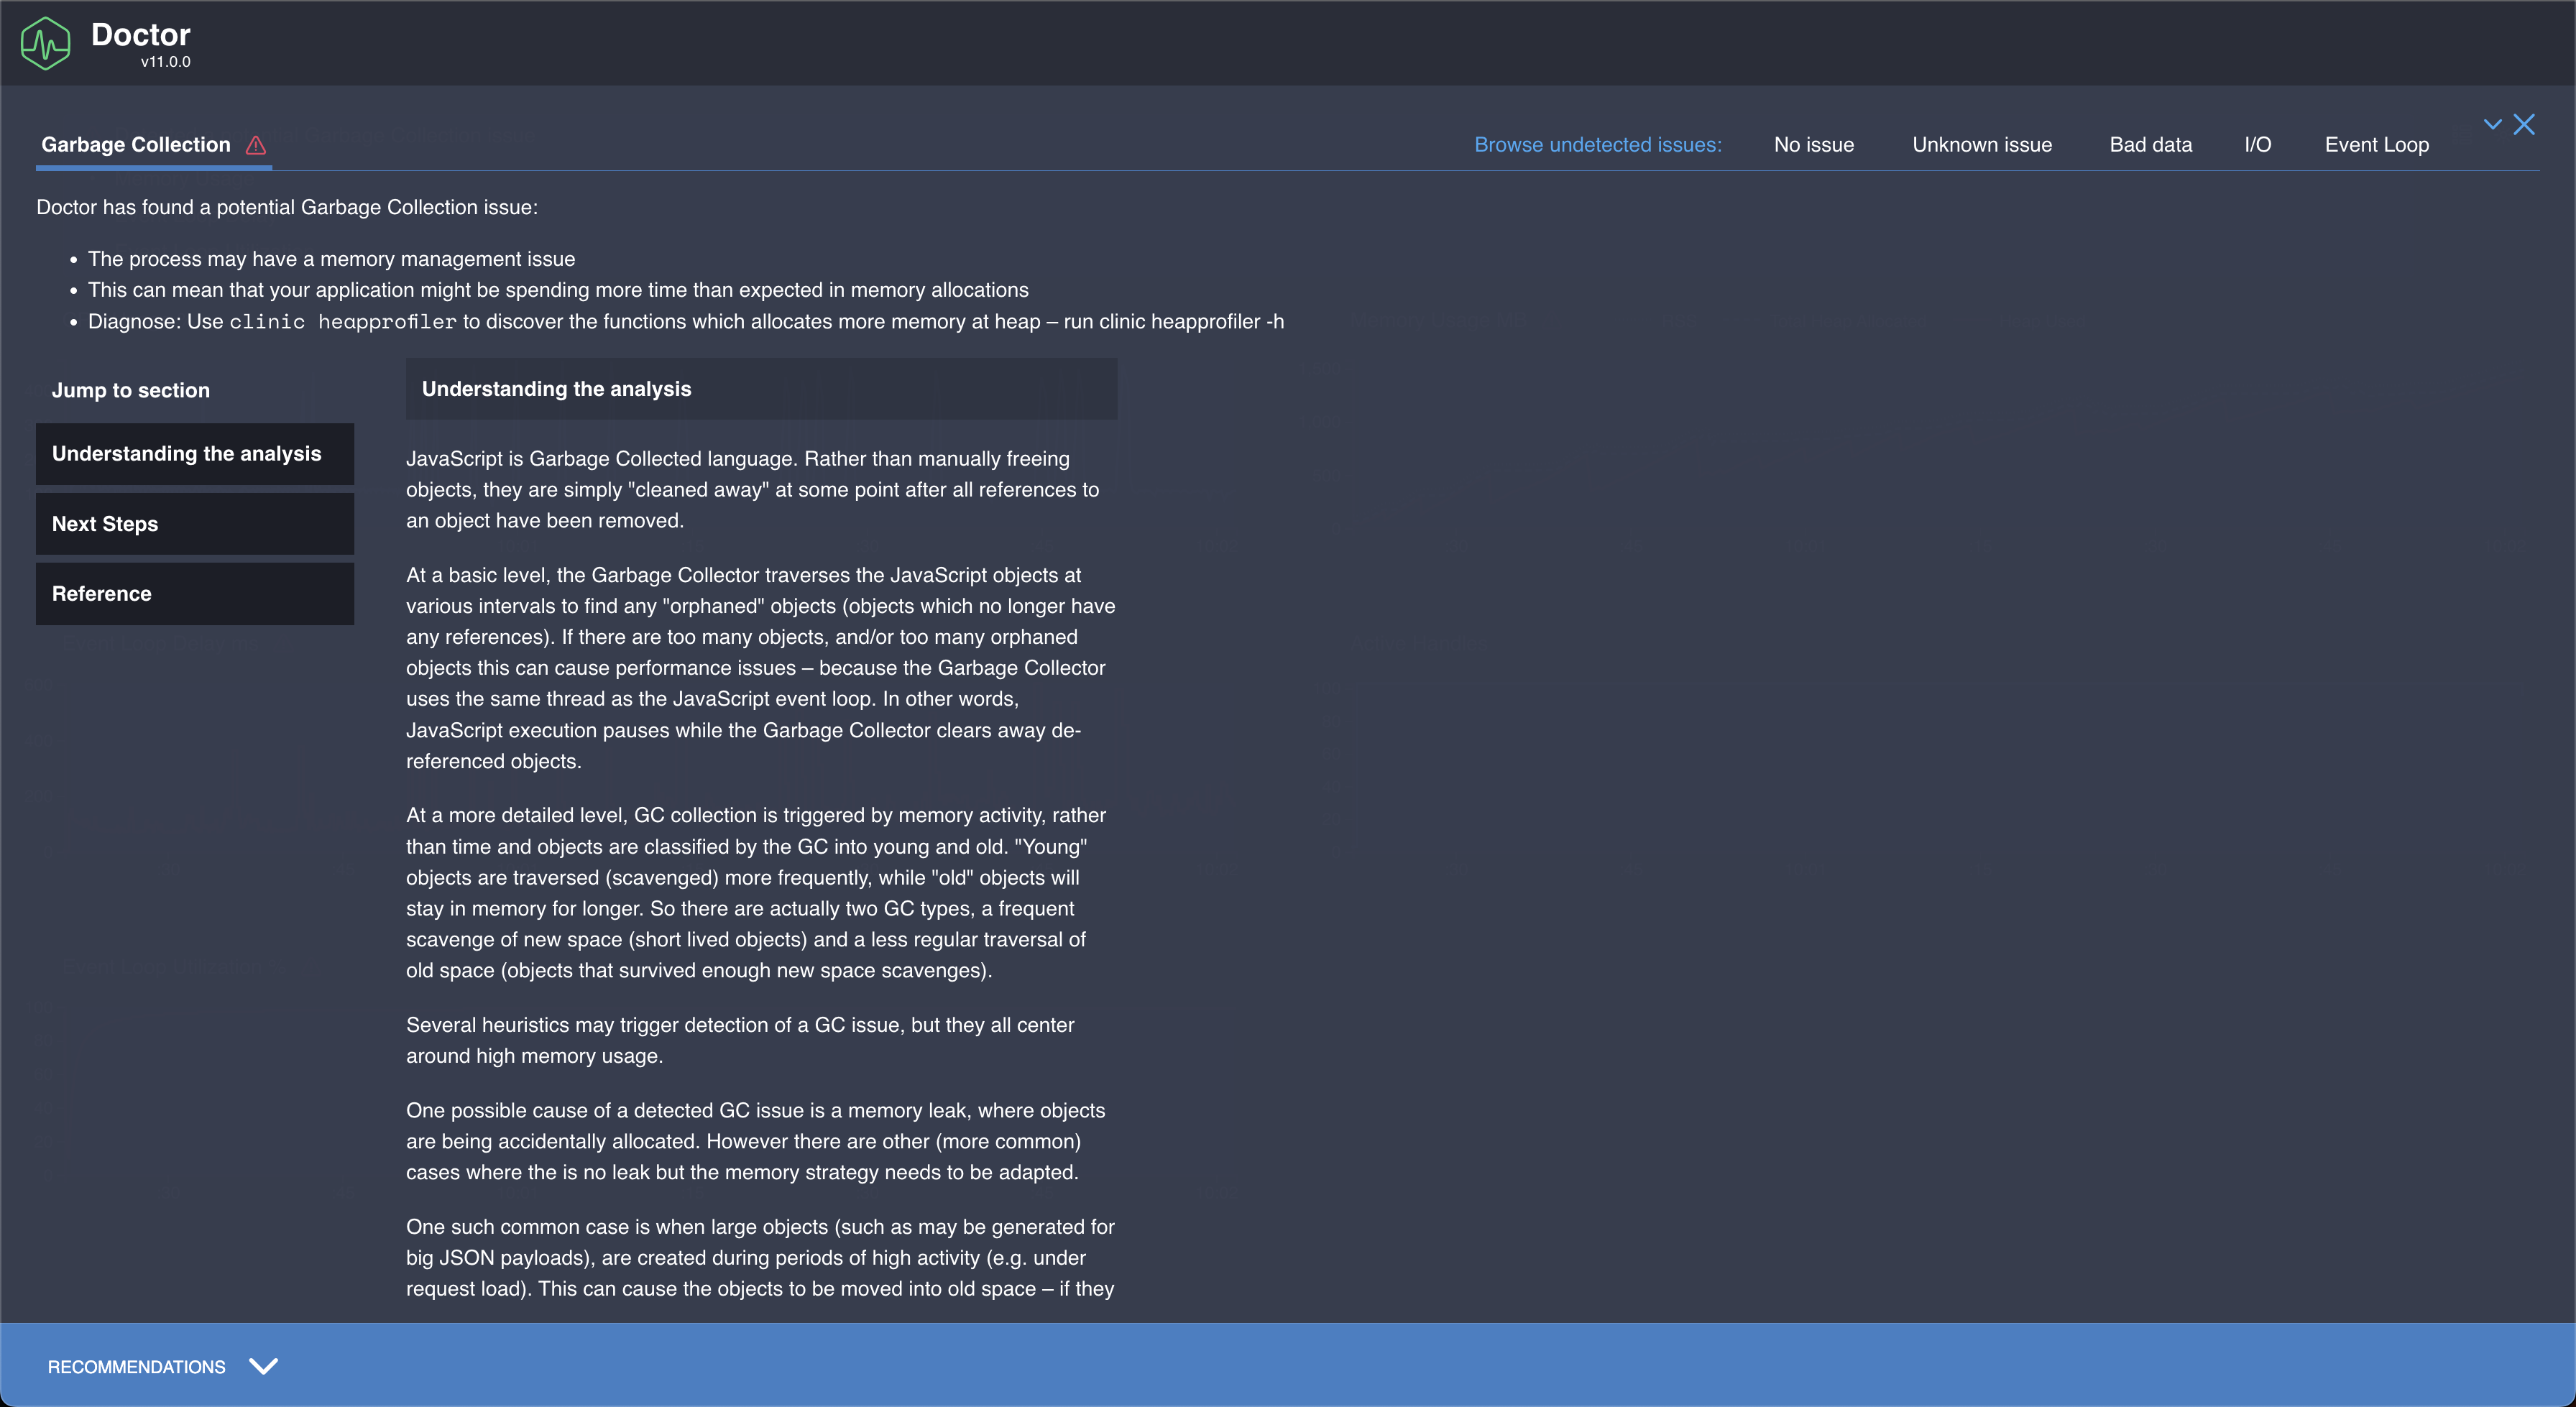
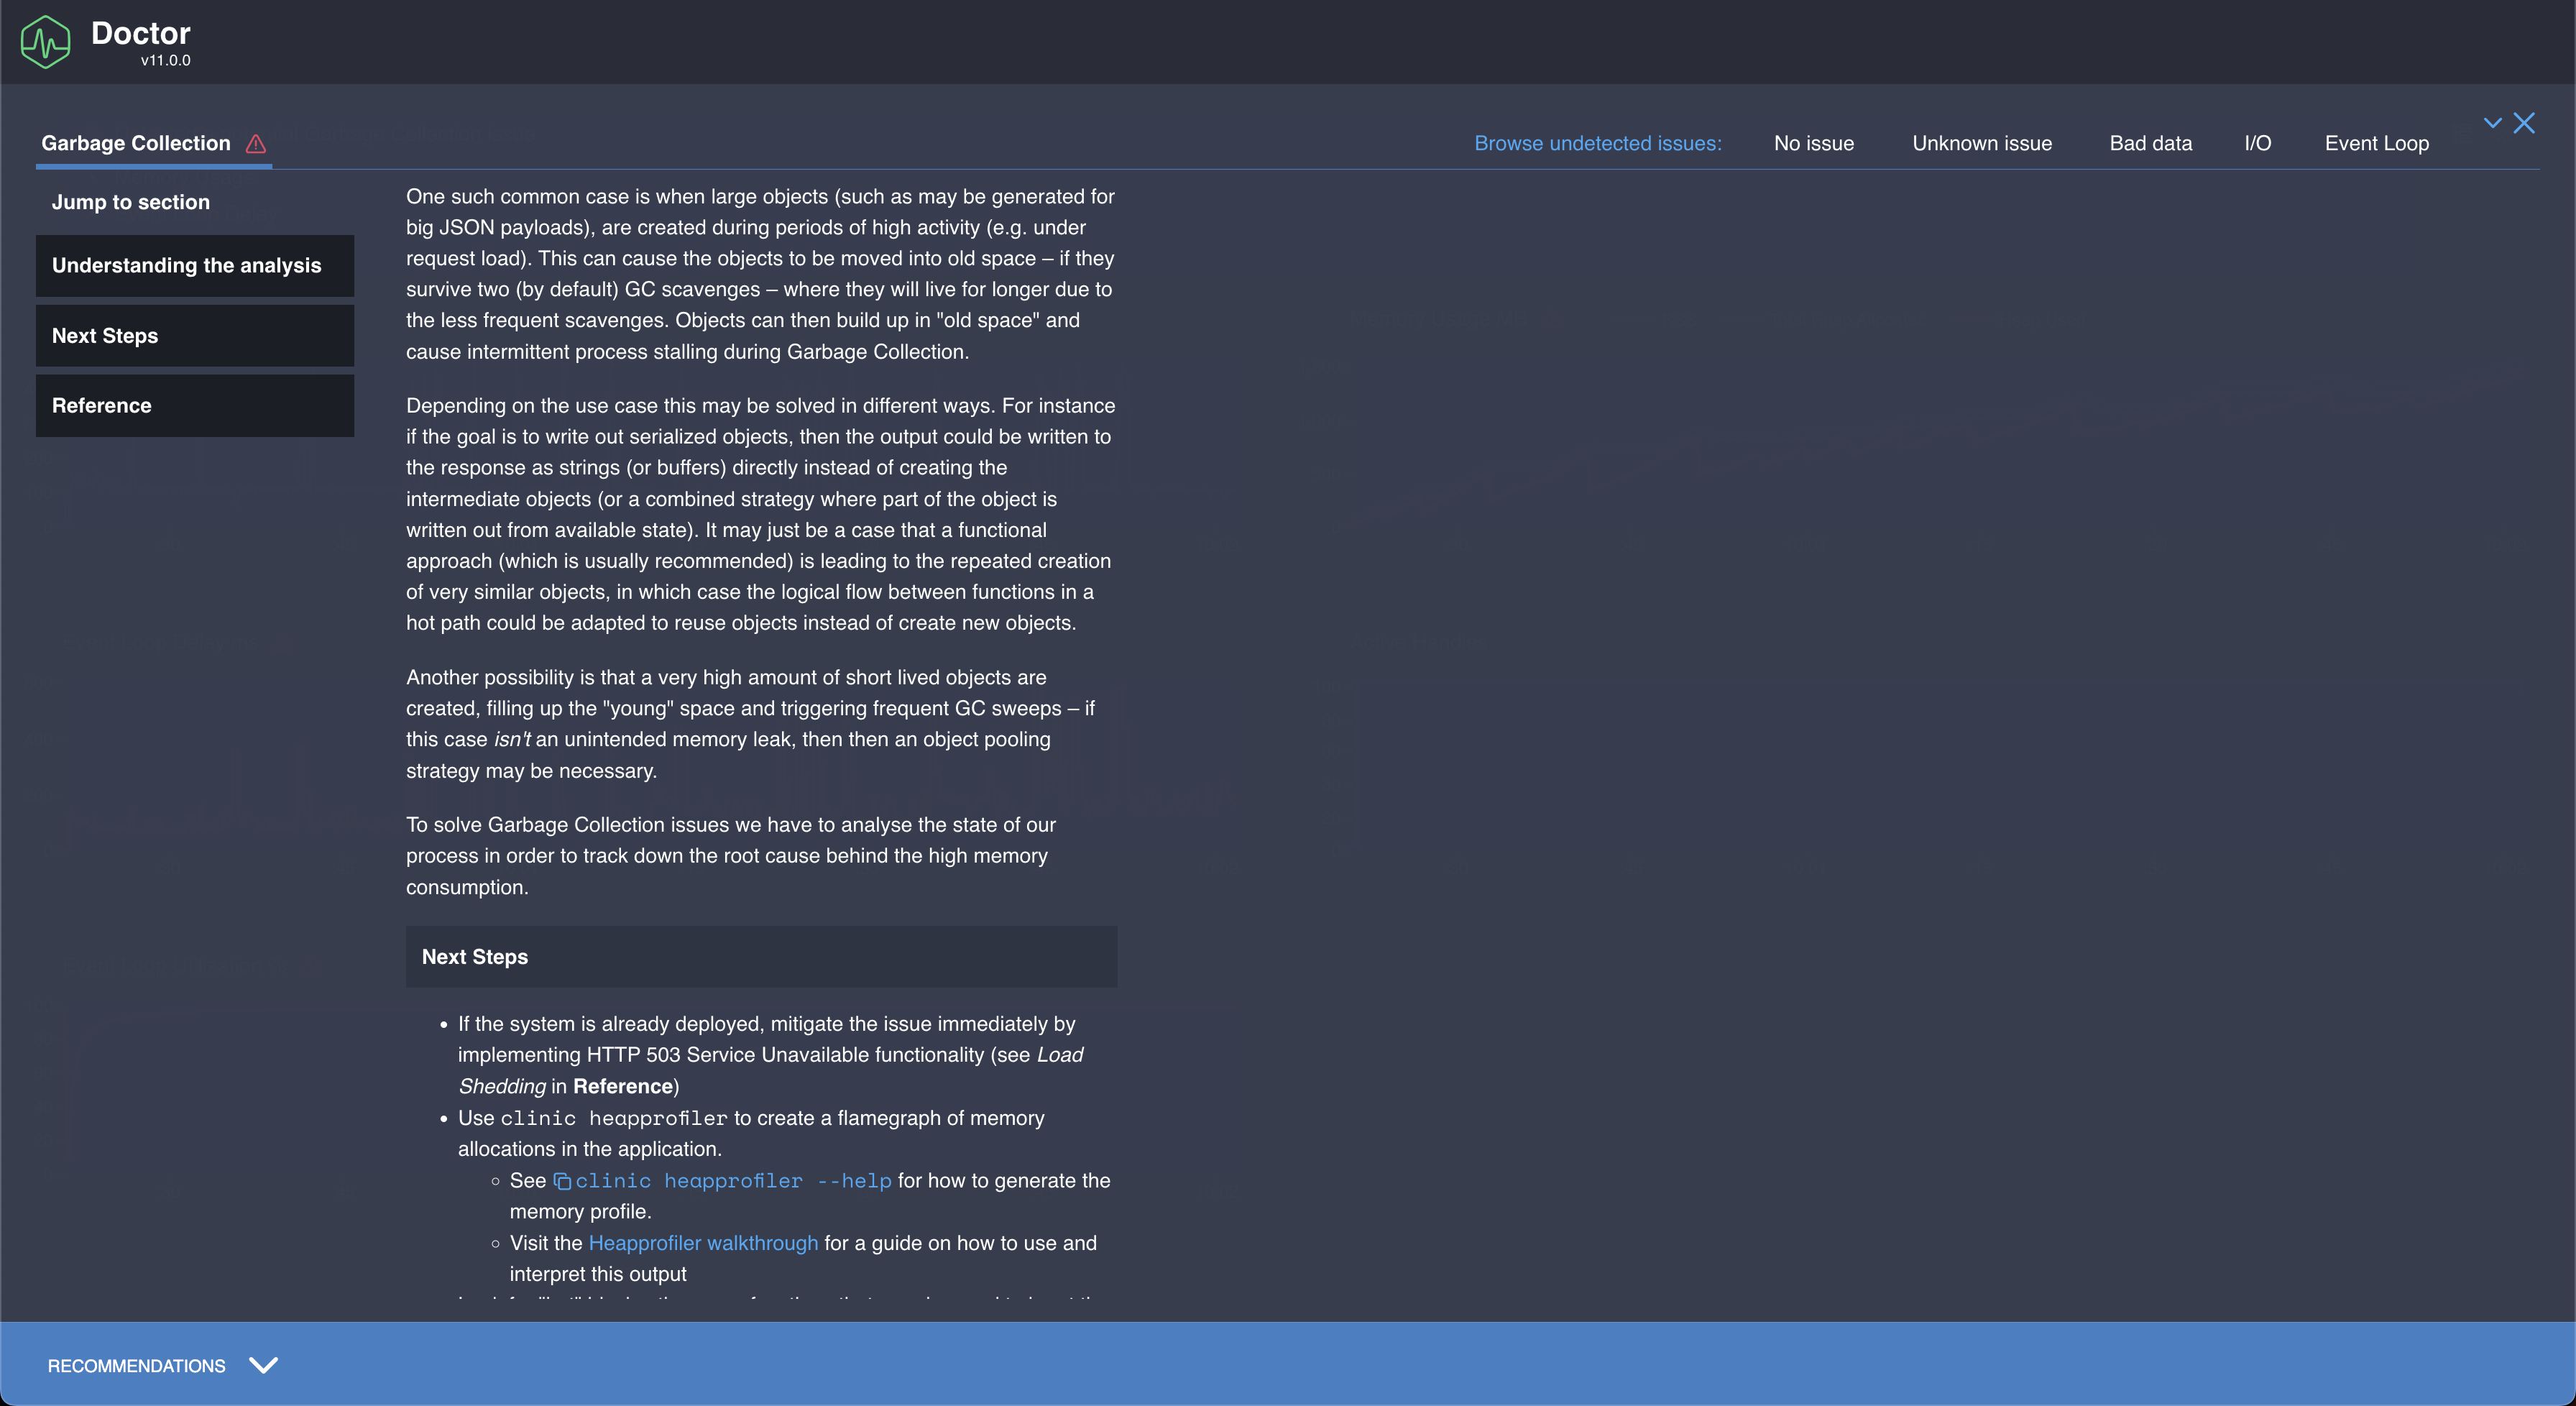
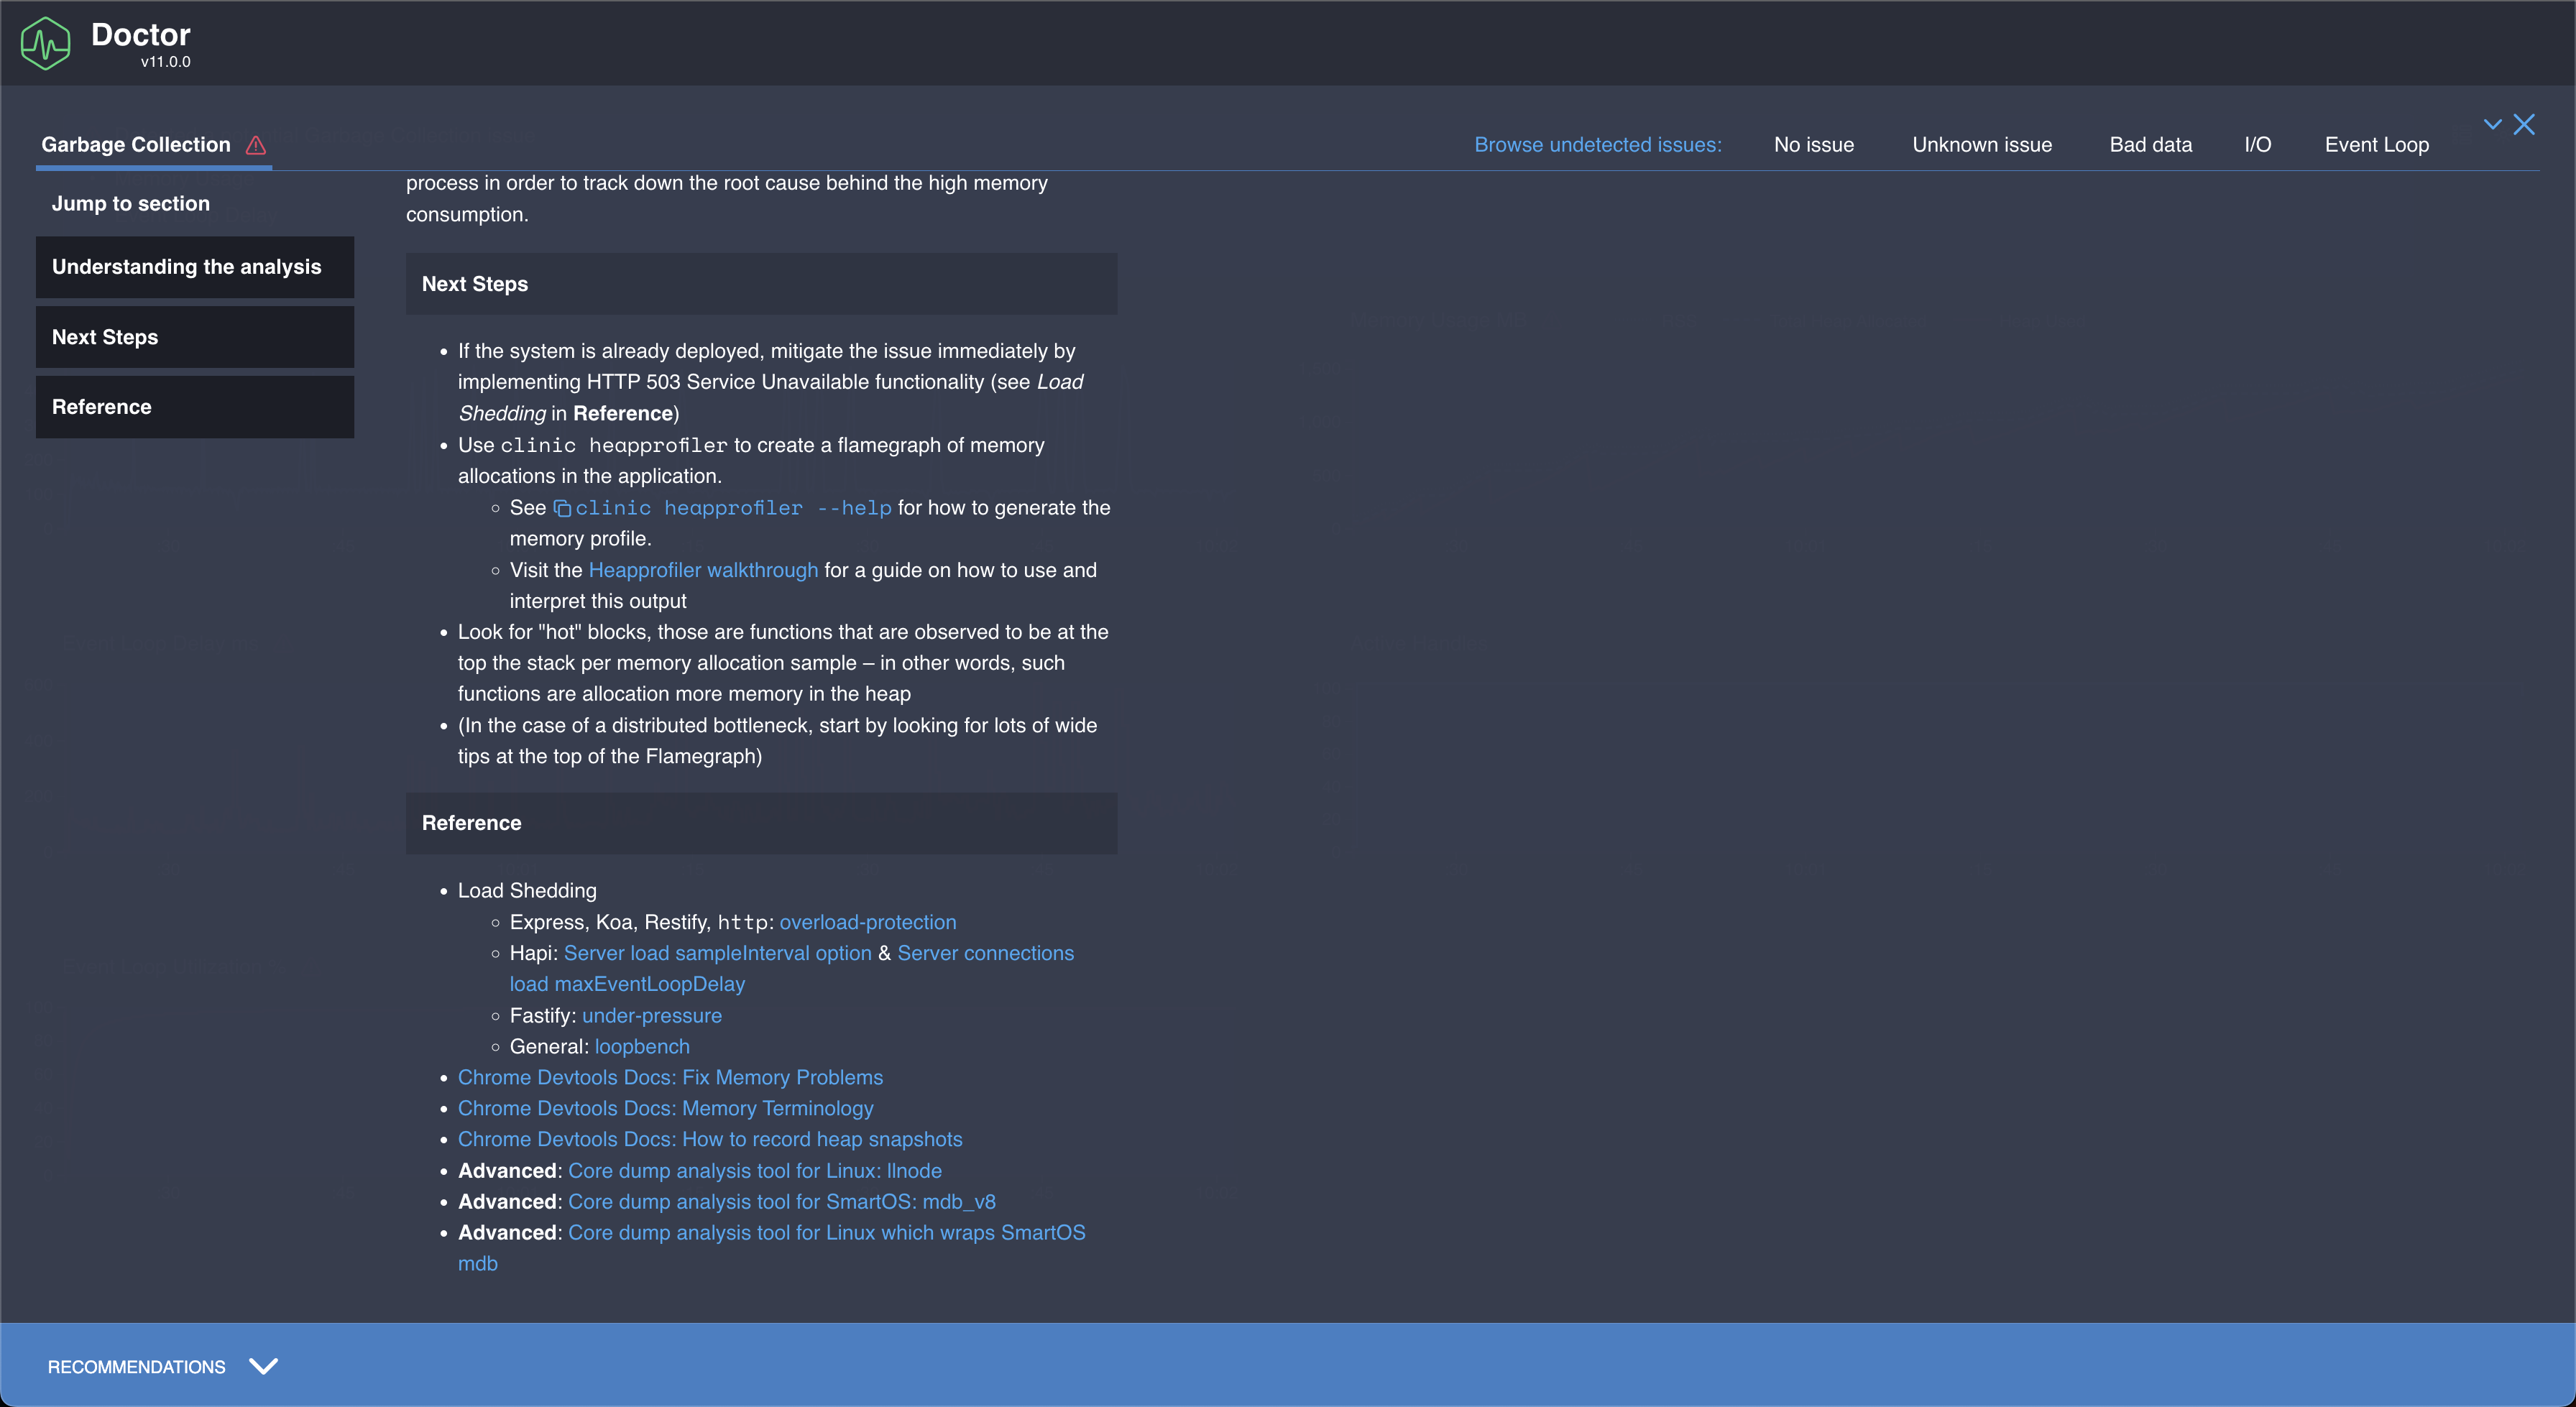
The clinic doctor command HTML output file is here - https://github.com/karuppiah7890/blog-content/blob/main/debugging-and-fixing-memory-leak-in-nodejs-service/35852.clinic-doctor.html
As mentioned in the recommendations - it talks about a possible memory management issue and asks to use the heap profiler
Below is how the heapprofiler command output looks like -
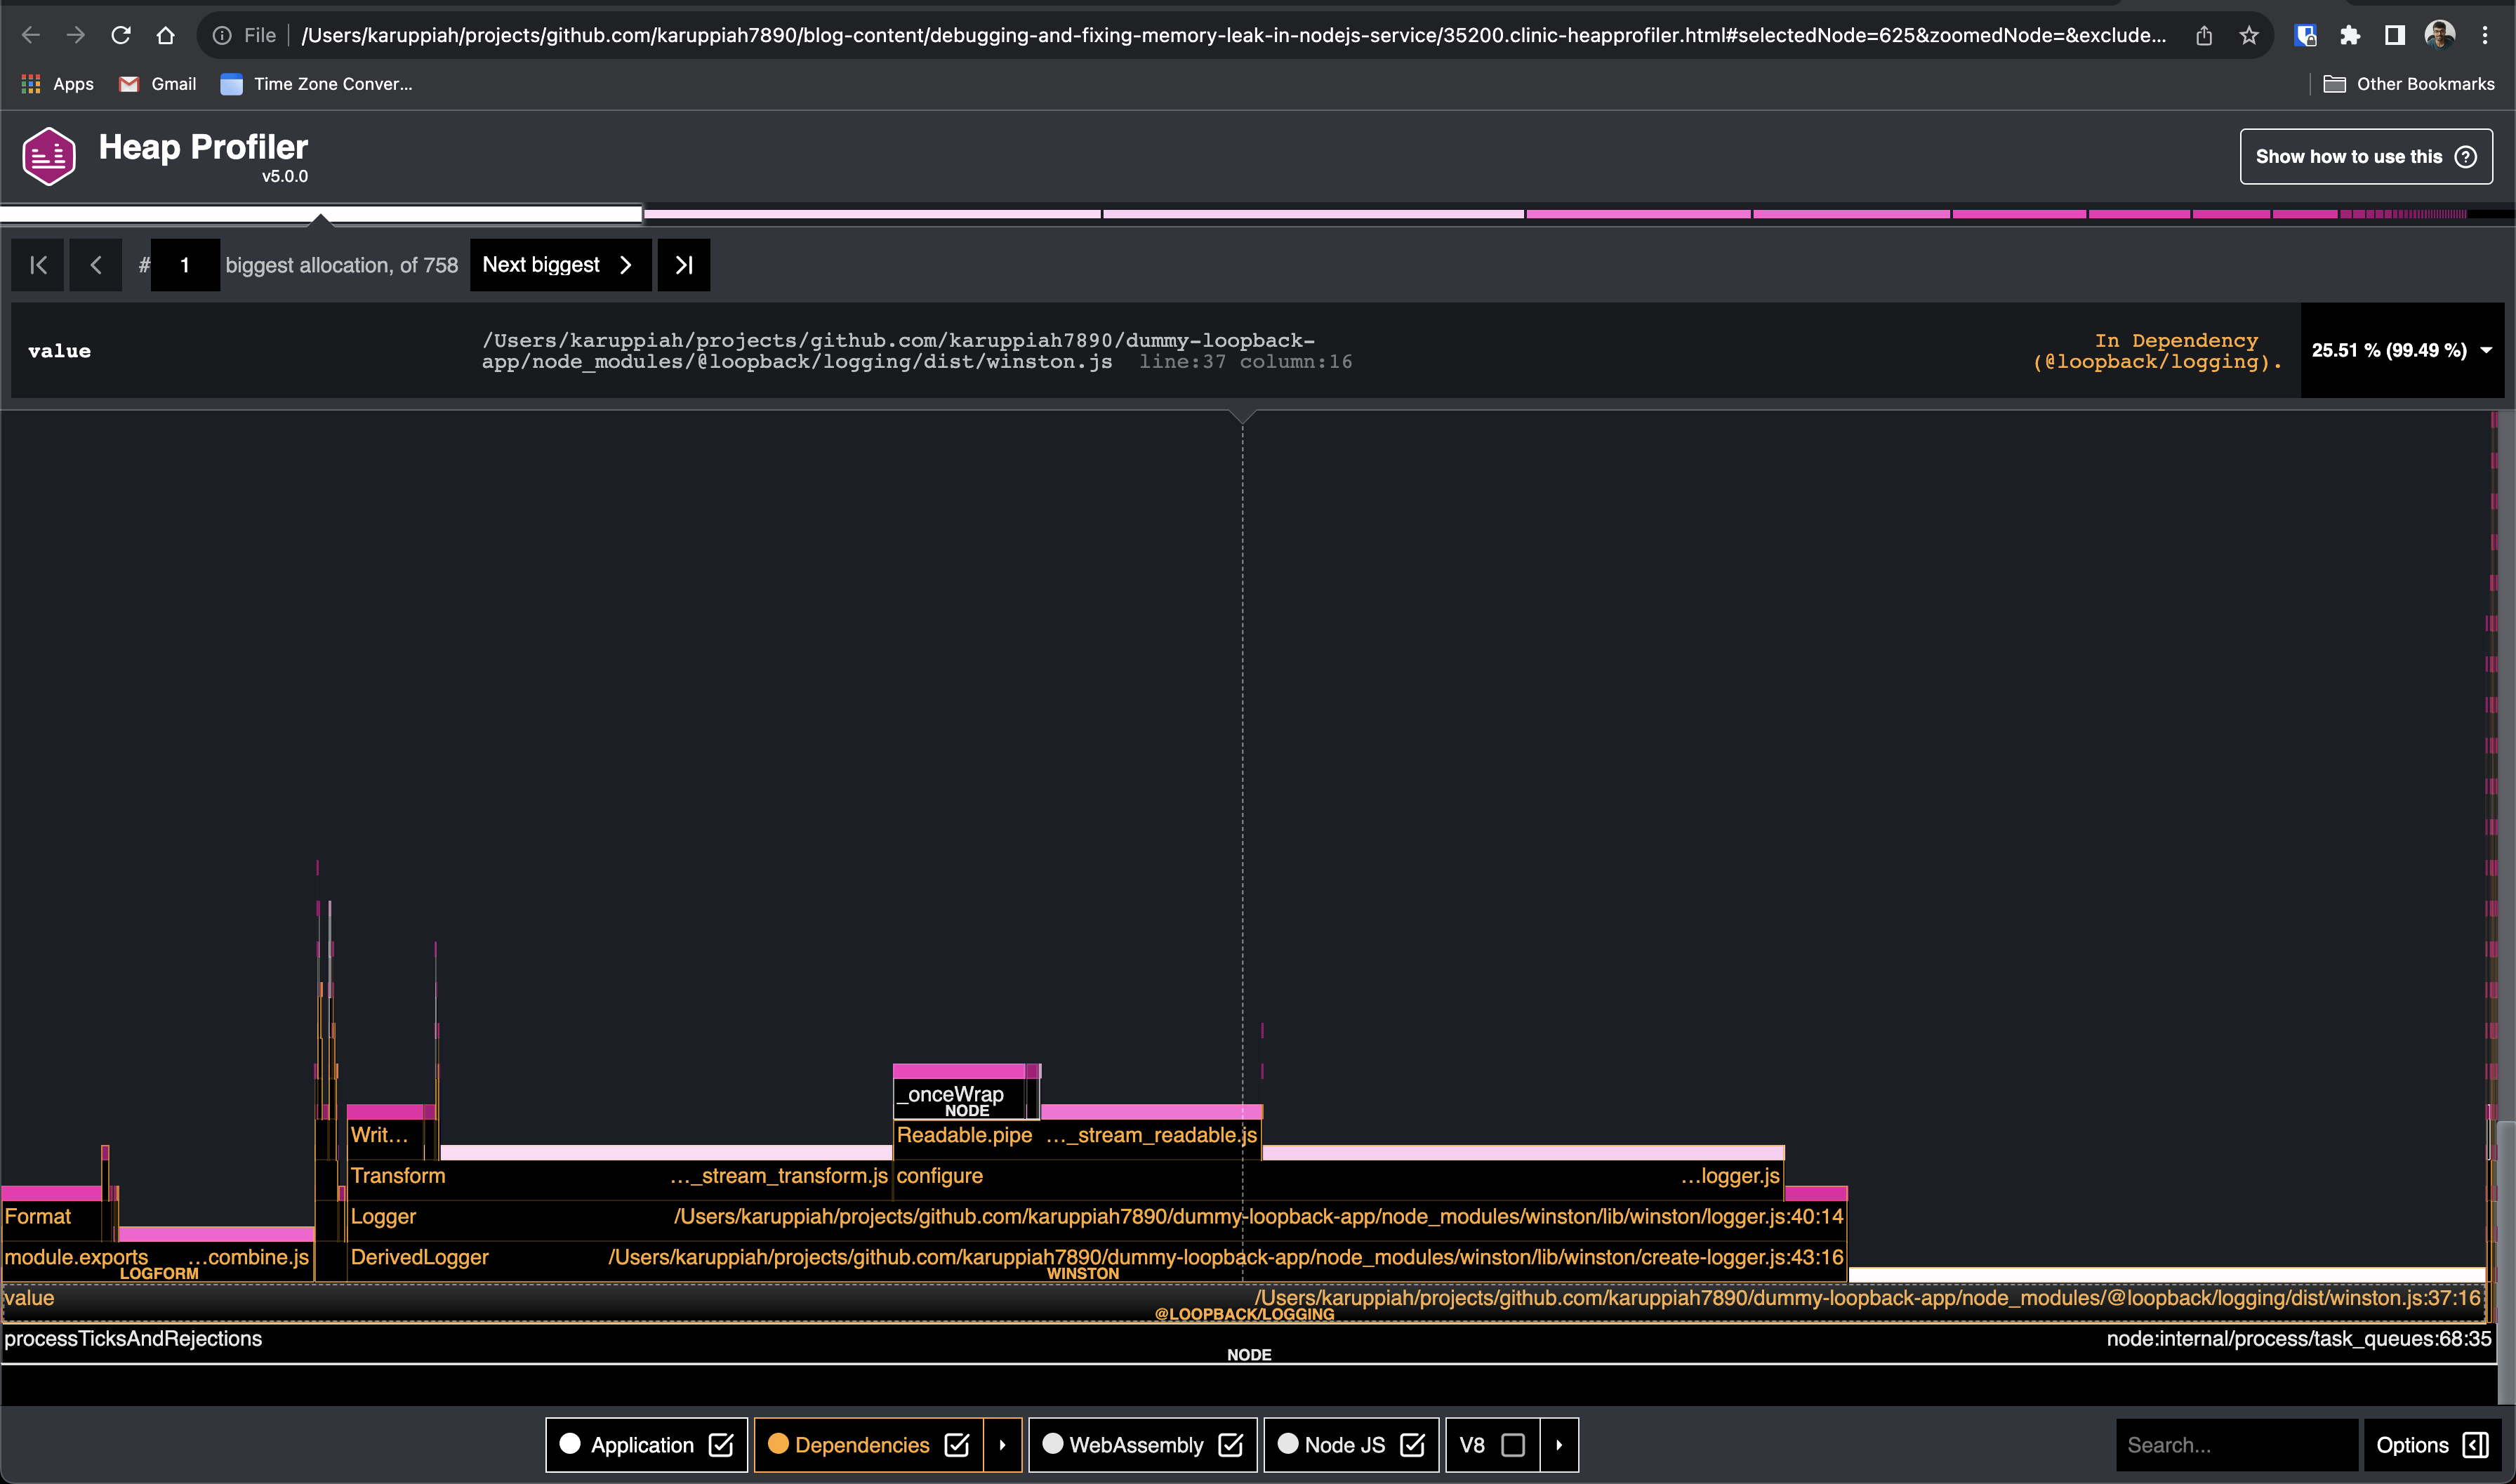
The clinic heapprofiler command HTML output file is here - https://github.com/karuppiah7890/blog-content/blob/main/debugging-and-fixing-memory-leak-in-nodejs-service/35200.clinic-heapprofiler.html
Below is an example log of how things would look like while running the doctor tool -
$ NODE_ENV=production clinic doctor --autocannon [ --headers accept=application/json --headers content-type=application/json --method GET http://localhost:3000/ping  --connections 100 --duration 100 ] -- node --trace-warnings dist/index.js
WARNING: NODE_ENV value of 'production' did not match any deployment config file names.
WARNING: See https://github.com/node-config/node-config/wiki/Strict-Mode
Server is running at http://[::1]:3000
Try http://[::1]:3000/ping
Running 100s test @ http://localhost:3000/ping
100 connections

running [                    ] 0%(node:35852) MaxListenersExceededWarning: Possible EventEmitter memory leak detected. 11 unpipe listeners added to [DailyRotateFile]. Use emitter.setMaxListeners() to increase limit
    at _addListener (node:events:601:17)
    at DailyRotateFile.addListener (node:events:619:10)
    at DerivedLogger.Readable.pipe (/Users/karuppiah/projects/github.com/karuppiah7890/dummy-loopback-app/node_modules/winston/node_modules/readable-stream/lib/_stream_readable.js:584:8)
    at DerivedLogger.add (/Users/karuppiah/projects/github.com/karuppiah7890/dummy-loopback-app/node_modules/winston/lib/winston/logger.js:364:10)
    at /Users/karuppiah/projects/github.com/karuppiah7890/dummy-loopback-app/node_modules/winston/lib/winston/logger.js:124:44
    at Array.forEach (<anonymous>)
    at DerivedLogger.configure (/Users/karuppiah/projects/github.com/karuppiah7890/dummy-loopback-app/node_modules/winston/lib/winston/logger.js:124:18)
    at new Logger (/Users/karuppiah/projects/github.com/karuppiah7890/dummy-loopback-app/node_modules/winston/lib/winston/logger.js:42:10)
    at new DerivedLogger (/Users/karuppiah/projects/github.com/karuppiah7890/dummy-loopback-app/node_modules/winston/lib/winston/create-logger.js:44:7)
    at module.exports (/Users/karuppiah/projects/github.com/karuppiah7890/dummy-loopback-app/node_modules/winston/lib/winston/create-logger.js:48:18)
    at WinstonLoggerProvider.value (/Users/karuppiah/projects/github.com/karuppiah7890/dummy-loopback-app/node_modules/@loopback/logging/dist/winston.js:43:43)
    at processTicksAndRejections (node:internal/process/task_queues:96:5)
    at async Promise.all (index 0)
    at async Promise.all (index 0)
(node:35852) MaxListenersExceededWarning: Possible EventEmitter memory leak detected. 11 error listeners added to [DailyRotateFile]. Use emitter.setMaxListeners() to increase limit
    at _addListener (node:events:601:17)
    at DailyRotateFile.prependListener (node:events:633:14)
    at prependListener (/Users/karuppiah/projects/github.com/karuppiah7890/dummy-loopback-app/node_modules/winston/node_modules/readable-stream/lib/_stream_readable.js:82:69)
    at DerivedLogger.Readable.pipe (/Users/karuppiah/projects/github.com/karuppiah7890/dummy-loopback-app/node_modules/winston/node_modules/readable-stream/lib/_stream_readable.js:654:3)
    at DerivedLogger.add (/Users/karuppiah/projects/github.com/karuppiah7890/dummy-loopback-app/node_modules/winston/lib/winston/logger.js:364:10)
    at /Users/karuppiah/projects/github.com/karuppiah7890/dummy-loopback-app/node_modules/winston/lib/winston/logger.js:124:44
    at Array.forEach (<anonymous>)
    at DerivedLogger.configure (/Users/karuppiah/projects/github.com/karuppiah7890/dummy-loopback-app/node_modules/winston/lib/winston/logger.js:124:18)
    at new Logger (/Users/karuppiah/projects/github.com/karuppiah7890/dummy-loopback-app/node_modules/winston/lib/winston/logger.js:42:10)
    at new DerivedLogger (/Users/karuppiah/projects/github.com/karuppiah7890/dummy-loopback-app/node_modules/winston/lib/winston/create-logger.js:44:7)
    at module.exports (/Users/karuppiah/projects/github.com/karuppiah7890/dummy-loopback-app/node_modules/winston/lib/winston/create-logger.js:48:18)
    at WinstonLoggerProvider.value (/Users/karuppiah/projects/github.com/karuppiah7890/dummy-loopback-app/node_modules/@loopback/logging/dist/winston.js:43:43)
    at processTicksAndRejections (node:internal/process/task_queues:96:5)
    at async Promise.all (index 0)
    at async Promise.all (index 0)
(node:35852) MaxListenersExceededWarning: Possible EventEmitter memory leak detected. 11 drain listeners added to [DailyRotateFile]. Use emitter.setMaxListeners() to increase limit
    at _addListener (node:events:601:17)
    at DailyRotateFile.addListener (node:events:619:10)
    at DerivedLogger.Readable.pipe (/Users/karuppiah/projects/github.com/karuppiah7890/dummy-loopback-app/node_modules/winston/node_modules/readable-stream/lib/_stream_readable.js:604:8)
    at DerivedLogger.add (/Users/karuppiah/projects/github.com/karuppiah7890/dummy-loopback-app/node_modules/winston/lib/winston/logger.js:364:10)
    at /Users/karuppiah/projects/github.com/karuppiah7890/dummy-loopback-app/node_modules/winston/lib/winston/logger.js:124:44
    at Array.forEach (<anonymous>)
    at DerivedLogger.configure (/Users/karuppiah/projects/github.com/karuppiah7890/dummy-loopback-app/node_modules/winston/lib/winston/logger.js:124:18)
    at new Logger (/Users/karuppiah/projects/github.com/karuppiah7890/dummy-loopback-app/node_modules/winston/lib/winston/logger.js:42:10)
    at new DerivedLogger (/Users/karuppiah/projects/github.com/karuppiah7890/dummy-loopback-app/node_modules/winston/lib/winston/create-logger.js:44:7)
    at module.exports (/Users/karuppiah/projects/github.com/karuppiah7890/dummy-loopback-app/node_modules/winston/lib/winston/create-logger.js:48:18)
    at WinstonLoggerProvider.value (/Users/karuppiah/projects/github.com/karuppiah7890/dummy-loopback-app/node_modules/@loopback/logging/dist/winston.js:43:43)
    at processTicksAndRejections (node:internal/process/task_queues:96:5)
    at async Promise.all (index 0)
    at async ControllerRoute.invokeHandler (/Users/karuppiah/projects/github.com/karuppiah7890/dummy-loopback-app/node_modules/@loopback/rest/dist/router/controller-route.js:80:28)
    at async /Users/karuppiah/projects/github.com/karuppiah7890/dummy-loopback-app/node_modules/@loopback/rest/dist/providers/invoke-method.provider.js:37:32
(node:35852) MaxListenersExceededWarning: Possible EventEmitter memory leak detected. 11 close listeners added to [DailyRotateFile]. Use emitter.setMaxListeners() to increase limit
    at _addListener (node:events:601:17)
    at DailyRotateFile.addListener (node:events:619:10)
    at DailyRotateFile.once (node:events:663:8)
    at DerivedLogger.Readable.pipe (/Users/karuppiah/projects/github.com/karuppiah7890/dummy-loopback-app/node_modules/winston/node_modules/readable-stream/lib/_stream_readable.js:661:8)
    at DerivedLogger.add (/Users/karuppiah/projects/github.com/karuppiah7890/dummy-loopback-app/node_modules/winston/lib/winston/logger.js:364:10)
    at /Users/karuppiah/projects/github.com/karuppiah7890/dummy-loopback-app/node_modules/winston/lib/winston/logger.js:124:44
    at Array.forEach (<anonymous>)
    at DerivedLogger.configure (/Users/karuppiah/projects/github.com/karuppiah7890/dummy-loopback-app/node_modules/winston/lib/winston/logger.js:124:18)
    at new Logger (/Users/karuppiah/projects/github.com/karuppiah7890/dummy-loopback-app/node_modules/winston/lib/winston/logger.js:42:10)
    at new DerivedLogger (/Users/karuppiah/projects/github.com/karuppiah7890/dummy-loopback-app/node_modules/winston/lib/winston/create-logger.js:44:7)
    at module.exports (/Users/karuppiah/projects/github.com/karuppiah7890/dummy-loopback-app/node_modules/winston/lib/winston/create-logger.js:48:18)
    at WinstonLoggerProvider.value (/Users/karuppiah/projects/github.com/karuppiah7890/dummy-loopback-app/node_modules/@loopback/logging/dist/winston.js:43:43)
    at processTicksAndRejections (node:internal/process/task_queues:96:5)
    at async Promise.all (index 0)
    at async ControllerRoute.invokeHandler (/Users/karuppiah/projects/github.com/karuppiah7890/dummy-loopback-app/node_modules/@loopback/rest/dist/router/controller-route.js:80:28)
(node:35852) MaxListenersExceededWarning: Possible EventEmitter memory leak detected. 11 finish listeners added to [DailyRotateFile]. Use emitter.setMaxListeners() to increase limit
    at _addListener (node:events:601:17)
    at DailyRotateFile.addListener (node:events:619:10)
    at DailyRotateFile.once (node:events:663:8)
    at DerivedLogger.Readable.pipe (/Users/karuppiah/projects/github.com/karuppiah7890/dummy-loopback-app/node_modules/winston/node_modules/readable-stream/lib/_stream_readable.js:667:8)
    at DerivedLogger.add (/Users/karuppiah/projects/github.com/karuppiah7890/dummy-loopback-app/node_modules/winston/lib/winston/logger.js:364:10)
    at /Users/karuppiah/projects/github.com/karuppiah7890/dummy-loopback-app/node_modules/winston/lib/winston/logger.js:124:44
    at Array.forEach (<anonymous>)
    at DerivedLogger.configure (/Users/karuppiah/projects/github.com/karuppiah7890/dummy-loopback-app/node_modules/winston/lib/winston/logger.js:124:18)
    at new Logger (/Users/karuppiah/projects/github.com/karuppiah7890/dummy-loopback-app/node_modules/winston/lib/winston/logger.js:42:10)
    at new DerivedLogger (/Users/karuppiah/projects/github.com/karuppiah7890/dummy-loopback-app/node_modules/winston/lib/winston/create-logger.js:44:7)
    at module.exports (/Users/karuppiah/projects/github.com/karuppiah7890/dummy-loopback-app/node_modules/winston/lib/winston/create-logger.js:48:18)
    at WinstonLoggerProvider.value (/Users/karuppiah/projects/github.com/karuppiah7890/dummy-loopback-app/node_modules/@loopback/logging/dist/winston.js:43:43)
    at processTicksAndRejections (node:internal/process/task_queues:96:5)
    at async Promise.all (index 0)
    at async ControllerRoute.invokeHandler (/Users/karuppiah/projects/github.com/karuppiah7890/dummy-loopback-app/node_modules/@loopback/rest/dist/router/controller-route.js:80:28)

┌─────────┬───────┬────────┬────────┬────────┬───────────┬──────────┬────────┐
│ Stat    │ 2.5%  │ 50%    │ 97.5%  │ 99%    │ Avg       │ Stdev    │ Max    │
├─────────┼───────┼────────┼────────┼────────┼───────────┼──────────┼────────┤
│ Latency │ 79 ms │ 116 ms │ 320 ms │ 471 ms │ 135.41 ms │ 68.46 ms │ 786 ms │
└─────────┴───────┴────────┴────────┴────────┴───────────┴──────────┴────────┘
┌───────────┬───────┬────────┬────────┬────────┬────────┬────────┬───────┐
│ Stat      │ 1%    │ 2.5%   │ 50%    │ 97.5%  │ Avg    │ Stdev  │ Min   │
├───────────┼───────┼────────┼────────┼────────┼────────┼────────┼───────┤
│ Req/Sec   │ 210   │ 261    │ 714    │ 1185   │ 735.29 │ 238.01 │ 210   │
├───────────┼───────┼────────┼────────┼────────┼────────┼────────┼───────┤
│ Bytes/Sec │ 96 kB │ 119 kB │ 326 kB │ 542 kB │ 336 kB │ 109 kB │ 96 kB │
└───────────┴───────┴────────┴────────┴────────┴────────┴────────┴───────┘

Req/Bytes counts sampled once per second.
# of samples: 100

74k requests in 100.05s, 33.6 MB read
Analysing data
Generated HTML file is file:///Users/karuppiah/projects/github.com/karuppiah7890/dummy-loopback-app/.clinic/35852.clinic-doctor.html
Below is an example log of how things would look like while running the heap profiler -
$ NODE_ENV=production clinic heapprofiler --autocannon [ --headers accept=application/json --headers content-type=application/json --method GET http://localhost:3000/ping  --connections 100 --duration 100 ] -- node --trace-warnings dist/index.js
WARNING: NODE_ENV value of 'production' did not match any deployment config file names.
WARNING: See https://github.com/node-config/node-config/wiki/Strict-Mode
Server is running at http://[::1]:3000
Try http://[::1]:3000/ping
Running 100s test @ http://localhost:3000/ping
100 connections

running [                    ] 0%(node:35200) MaxListenersExceededWarning: Possible EventEmitter memory leak detected. 11 unpipe listeners added to [DailyRotateFile]. Use emitter.setMaxListeners() to increase limit
    at _addListener (node:events:601:17)
    at DailyRotateFile.addListener (node:events:619:10)
    at DerivedLogger.Readable.pipe (/Users/karuppiah/projects/github.com/karuppiah7890/dummy-loopback-app/node_modules/winston/node_modules/readable-stream/lib/_stream_readable.js:584:8)
    at DerivedLogger.add (/Users/karuppiah/projects/github.com/karuppiah7890/dummy-loopback-app/node_modules/winston/lib/winston/logger.js:364:10)
    at /Users/karuppiah/projects/github.com/karuppiah7890/dummy-loopback-app/node_modules/winston/lib/winston/logger.js:124:44
    at Array.forEach (<anonymous>)
    at DerivedLogger.configure (/Users/karuppiah/projects/github.com/karuppiah7890/dummy-loopback-app/node_modules/winston/lib/winston/logger.js:124:18)
    at new Logger (/Users/karuppiah/projects/github.com/karuppiah7890/dummy-loopback-app/node_modules/winston/lib/winston/logger.js:42:10)
    at new DerivedLogger (/Users/karuppiah/projects/github.com/karuppiah7890/dummy-loopback-app/node_modules/winston/lib/winston/create-logger.js:44:7)
    at module.exports (/Users/karuppiah/projects/github.com/karuppiah7890/dummy-loopback-app/node_modules/winston/lib/winston/create-logger.js:48:18)
    at WinstonLoggerProvider.value (/Users/karuppiah/projects/github.com/karuppiah7890/dummy-loopback-app/node_modules/@loopback/logging/dist/winston.js:43:43)
    at processTicksAndRejections (node:internal/process/task_queues:96:5)
    at async Promise.all (index 0)
    at async Promise.all (index 0)
(node:35200) MaxListenersExceededWarning: Possible EventEmitter memory leak detected. 11 error listeners added to [DailyRotateFile]. Use emitter.setMaxListeners() to increase limit
    at _addListener (node:events:601:17)
    at DailyRotateFile.prependListener (node:events:633:14)
    at prependListener (/Users/karuppiah/projects/github.com/karuppiah7890/dummy-loopback-app/node_modules/winston/node_modules/readable-stream/lib/_stream_readable.js:82:69)
    at DerivedLogger.Readable.pipe (/Users/karuppiah/projects/github.com/karuppiah7890/dummy-loopback-app/node_modules/winston/node_modules/readable-stream/lib/_stream_readable.js:654:3)
    at DerivedLogger.add (/Users/karuppiah/projects/github.com/karuppiah7890/dummy-loopback-app/node_modules/winston/lib/winston/logger.js:364:10)
    at /Users/karuppiah/projects/github.com/karuppiah7890/dummy-loopback-app/node_modules/winston/lib/winston/logger.js:124:44
    at Array.forEach (<anonymous>)
    at DerivedLogger.configure (/Users/karuppiah/projects/github.com/karuppiah7890/dummy-loopback-app/node_modules/winston/lib/winston/logger.js:124:18)
    at new Logger (/Users/karuppiah/projects/github.com/karuppiah7890/dummy-loopback-app/node_modules/winston/lib/winston/logger.js:42:10)
    at new DerivedLogger (/Users/karuppiah/projects/github.com/karuppiah7890/dummy-loopback-app/node_modules/winston/lib/winston/create-logger.js:44:7)
    at module.exports (/Users/karuppiah/projects/github.com/karuppiah7890/dummy-loopback-app/node_modules/winston/lib/winston/create-logger.js:48:18)
    at WinstonLoggerProvider.value (/Users/karuppiah/projects/github.com/karuppiah7890/dummy-loopback-app/node_modules/@loopback/logging/dist/winston.js:43:43)
    at processTicksAndRejections (node:internal/process/task_queues:96:5)
    at async Promise.all (index 0)
    at async Promise.all (index 0)
(node:35200) MaxListenersExceededWarning: Possible EventEmitter memory leak detected. 11 drain listeners added to [DailyRotateFile]. Use emitter.setMaxListeners() to increase limit
    at _addListener (node:events:601:17)
    at DailyRotateFile.addListener (node:events:619:10)
    at DerivedLogger.Readable.pipe (/Users/karuppiah/projects/github.com/karuppiah7890/dummy-loopback-app/node_modules/winston/node_modules/readable-stream/lib/_stream_readable.js:604:8)
    at DerivedLogger.add (/Users/karuppiah/projects/github.com/karuppiah7890/dummy-loopback-app/node_modules/winston/lib/winston/logger.js:364:10)
    at /Users/karuppiah/projects/github.com/karuppiah7890/dummy-loopback-app/node_modules/winston/lib/winston/logger.js:124:44
    at Array.forEach (<anonymous>)
    at DerivedLogger.configure (/Users/karuppiah/projects/github.com/karuppiah7890/dummy-loopback-app/node_modules/winston/lib/winston/logger.js:124:18)
    at new Logger (/Users/karuppiah/projects/github.com/karuppiah7890/dummy-loopback-app/node_modules/winston/lib/winston/logger.js:42:10)
    at new DerivedLogger (/Users/karuppiah/projects/github.com/karuppiah7890/dummy-loopback-app/node_modules/winston/lib/winston/create-logger.js:44:7)
    at module.exports (/Users/karuppiah/projects/github.com/karuppiah7890/dummy-loopback-app/node_modules/winston/lib/winston/create-logger.js:48:18)
    at WinstonLoggerProvider.value (/Users/karuppiah/projects/github.com/karuppiah7890/dummy-loopback-app/node_modules/@loopback/logging/dist/winston.js:43:43)
    at processTicksAndRejections (node:internal/process/task_queues:96:5)
    at async Promise.all (index 0)
    at async ControllerRoute.invokeHandler (/Users/karuppiah/projects/github.com/karuppiah7890/dummy-loopback-app/node_modules/@loopback/rest/dist/router/controller-route.js:80:28)
    at async /Users/karuppiah/projects/github.com/karuppiah7890/dummy-loopback-app/node_modules/@loopback/rest/dist/providers/invoke-method.provider.js:37:32
(node:35200) MaxListenersExceededWarning: Possible EventEmitter memory leak detected. 11 close listeners added to [DailyRotateFile]. Use emitter.setMaxListeners() to increase limit
    at _addListener (node:events:601:17)
    at DailyRotateFile.addListener (node:events:619:10)
    at DailyRotateFile.once (node:events:663:8)
    at DerivedLogger.Readable.pipe (/Users/karuppiah/projects/github.com/karuppiah7890/dummy-loopback-app/node_modules/winston/node_modules/readable-stream/lib/_stream_readable.js:661:8)
    at DerivedLogger.add (/Users/karuppiah/projects/github.com/karuppiah7890/dummy-loopback-app/node_modules/winston/lib/winston/logger.js:364:10)
    at /Users/karuppiah/projects/github.com/karuppiah7890/dummy-loopback-app/node_modules/winston/lib/winston/logger.js:124:44
    at Array.forEach (<anonymous>)
    at DerivedLogger.configure (/Users/karuppiah/projects/github.com/karuppiah7890/dummy-loopback-app/node_modules/winston/lib/winston/logger.js:124:18)
    at new Logger (/Users/karuppiah/projects/github.com/karuppiah7890/dummy-loopback-app/node_modules/winston/lib/winston/logger.js:42:10)
    at new DerivedLogger (/Users/karuppiah/projects/github.com/karuppiah7890/dummy-loopback-app/node_modules/winston/lib/winston/create-logger.js:44:7)
    at module.exports (/Users/karuppiah/projects/github.com/karuppiah7890/dummy-loopback-app/node_modules/winston/lib/winston/create-logger.js:48:18)
    at WinstonLoggerProvider.value (/Users/karuppiah/projects/github.com/karuppiah7890/dummy-loopback-app/node_modules/@loopback/logging/dist/winston.js:43:43)
    at processTicksAndRejections (node:internal/process/task_queues:96:5)
    at async Promise.all (index 0)
    at async ControllerRoute.invokeHandler (/Users/karuppiah/projects/github.com/karuppiah7890/dummy-loopback-app/node_modules/@loopback/rest/dist/router/controller-route.js:80:28)
(node:35200) MaxListenersExceededWarning: Possible EventEmitter memory leak detected. 11 finish listeners added to [DailyRotateFile]. Use emitter.setMaxListeners() to increase limit
    at _addListener (node:events:601:17)
    at DailyRotateFile.addListener (node:events:619:10)
    at DailyRotateFile.once (node:events:663:8)
    at DerivedLogger.Readable.pipe (/Users/karuppiah/projects/github.com/karuppiah7890/dummy-loopback-app/node_modules/winston/node_modules/readable-stream/lib/_stream_readable.js:667:8)
    at DerivedLogger.add (/Users/karuppiah/projects/github.com/karuppiah7890/dummy-loopback-app/node_modules/winston/lib/winston/logger.js:364:10)
    at /Users/karuppiah/projects/github.com/karuppiah7890/dummy-loopback-app/node_modules/winston/lib/winston/logger.js:124:44
    at Array.forEach (<anonymous>)
    at DerivedLogger.configure (/Users/karuppiah/projects/github.com/karuppiah7890/dummy-loopback-app/node_modules/winston/lib/winston/logger.js:124:18)
    at new Logger (/Users/karuppiah/projects/github.com/karuppiah7890/dummy-loopback-app/node_modules/winston/lib/winston/logger.js:42:10)
    at new DerivedLogger (/Users/karuppiah/projects/github.com/karuppiah7890/dummy-loopback-app/node_modules/winston/lib/winston/create-logger.js:44:7)
    at module.exports (/Users/karuppiah/projects/github.com/karuppiah7890/dummy-loopback-app/node_modules/winston/lib/winston/create-logger.js:48:18)
    at WinstonLoggerProvider.value (/Users/karuppiah/projects/github.com/karuppiah7890/dummy-loopback-app/node_modules/@loopback/logging/dist/winston.js:43:43)
    at processTicksAndRejections (node:internal/process/task_queues:96:5)
    at async Promise.all (index 0)
    at async ControllerRoute.invokeHandler (/Users/karuppiah/projects/github.com/karuppiah7890/dummy-loopback-app/node_modules/@loopback/rest/dist/router/controller-route.js:80:28)

┌─────────┬───────┬────────┬────────┬────────┬───────────┬──────────┬────────┐
│ Stat    │ 2.5%  │ 50%    │ 97.5%  │ 99%    │ Avg       │ Stdev    │ Max    │
├─────────┼───────┼────────┼────────┼────────┼───────────┼──────────┼────────┤
│ Latency │ 87 ms │ 118 ms │ 313 ms │ 495 ms │ 133.59 ms │ 70.79 ms │ 931 ms │
└─────────┴───────┴────────┴────────┴────────┴───────────┴──────────┴────────┘
┌───────────┬─────────┬─────────┬────────┬────────┬────────┬─────────┬─────────┐
│ Stat      │ 1%      │ 2.5%    │ 50%    │ 97.5%  │ Avg    │ Stdev   │ Min     │
├───────────┼─────────┼─────────┼────────┼────────┼────────┼─────────┼─────────┤
│ Req/Sec   │ 112     │ 216     │ 769    │ 1090   │ 745.44 │ 218.4   │ 112     │
├───────────┼─────────┼─────────┼────────┼────────┼────────┼─────────┼─────────┤
│ Bytes/Sec │ 51.2 kB │ 98.8 kB │ 351 kB │ 498 kB │ 341 kB │ 99.8 kB │ 51.2 kB │
└───────────┴─────────┴─────────┴────────┴────────┴────────┴─────────┴─────────┘

Req/Bytes counts sampled once per second.
# of samples: 100

75k requests in 100.06s, 34.1 MB read
Analysing data
Generated HTML file is file:///Users/karuppiah/projects/github.com/karuppiah7890/dummy-loopback-app/.clinic/35200.clinic-heapprofiler.html
I also did load test and did a heap dump and checked heap dump data. Below is how I did it
I first ran the service with inspector activated using --inspect option of node
node --inspect --trace-warnings dist/index.js
I got an output that looked like this -
$ node --inspect --trace-warnings dist/index.js
Debugger listening on ws://127.0.0.1:9229/143f1ab8-1754-48a7-a394-bbc973c5e1fb
For help, see: https://nodejs.org/en/docs/inspector
Debugger attached.
Server is running at http://[::1]:3000
Try http://[::1]:3000/ping
After this, I connected to the Node.js debugger using Chrome DevTools

And then I ran the autocannon tool to load test the service. I used lot of connections and more duration in this case
autocannon \
  --headers accept=application/json \
  --headers content-type=application/json \
  --method GET http://localhost:3000/ping  \
  --connections 1000 --duration 300
Below are screenshots of the heap snapshots I took, and also allocation instrumentation on timeline and allocation sampling
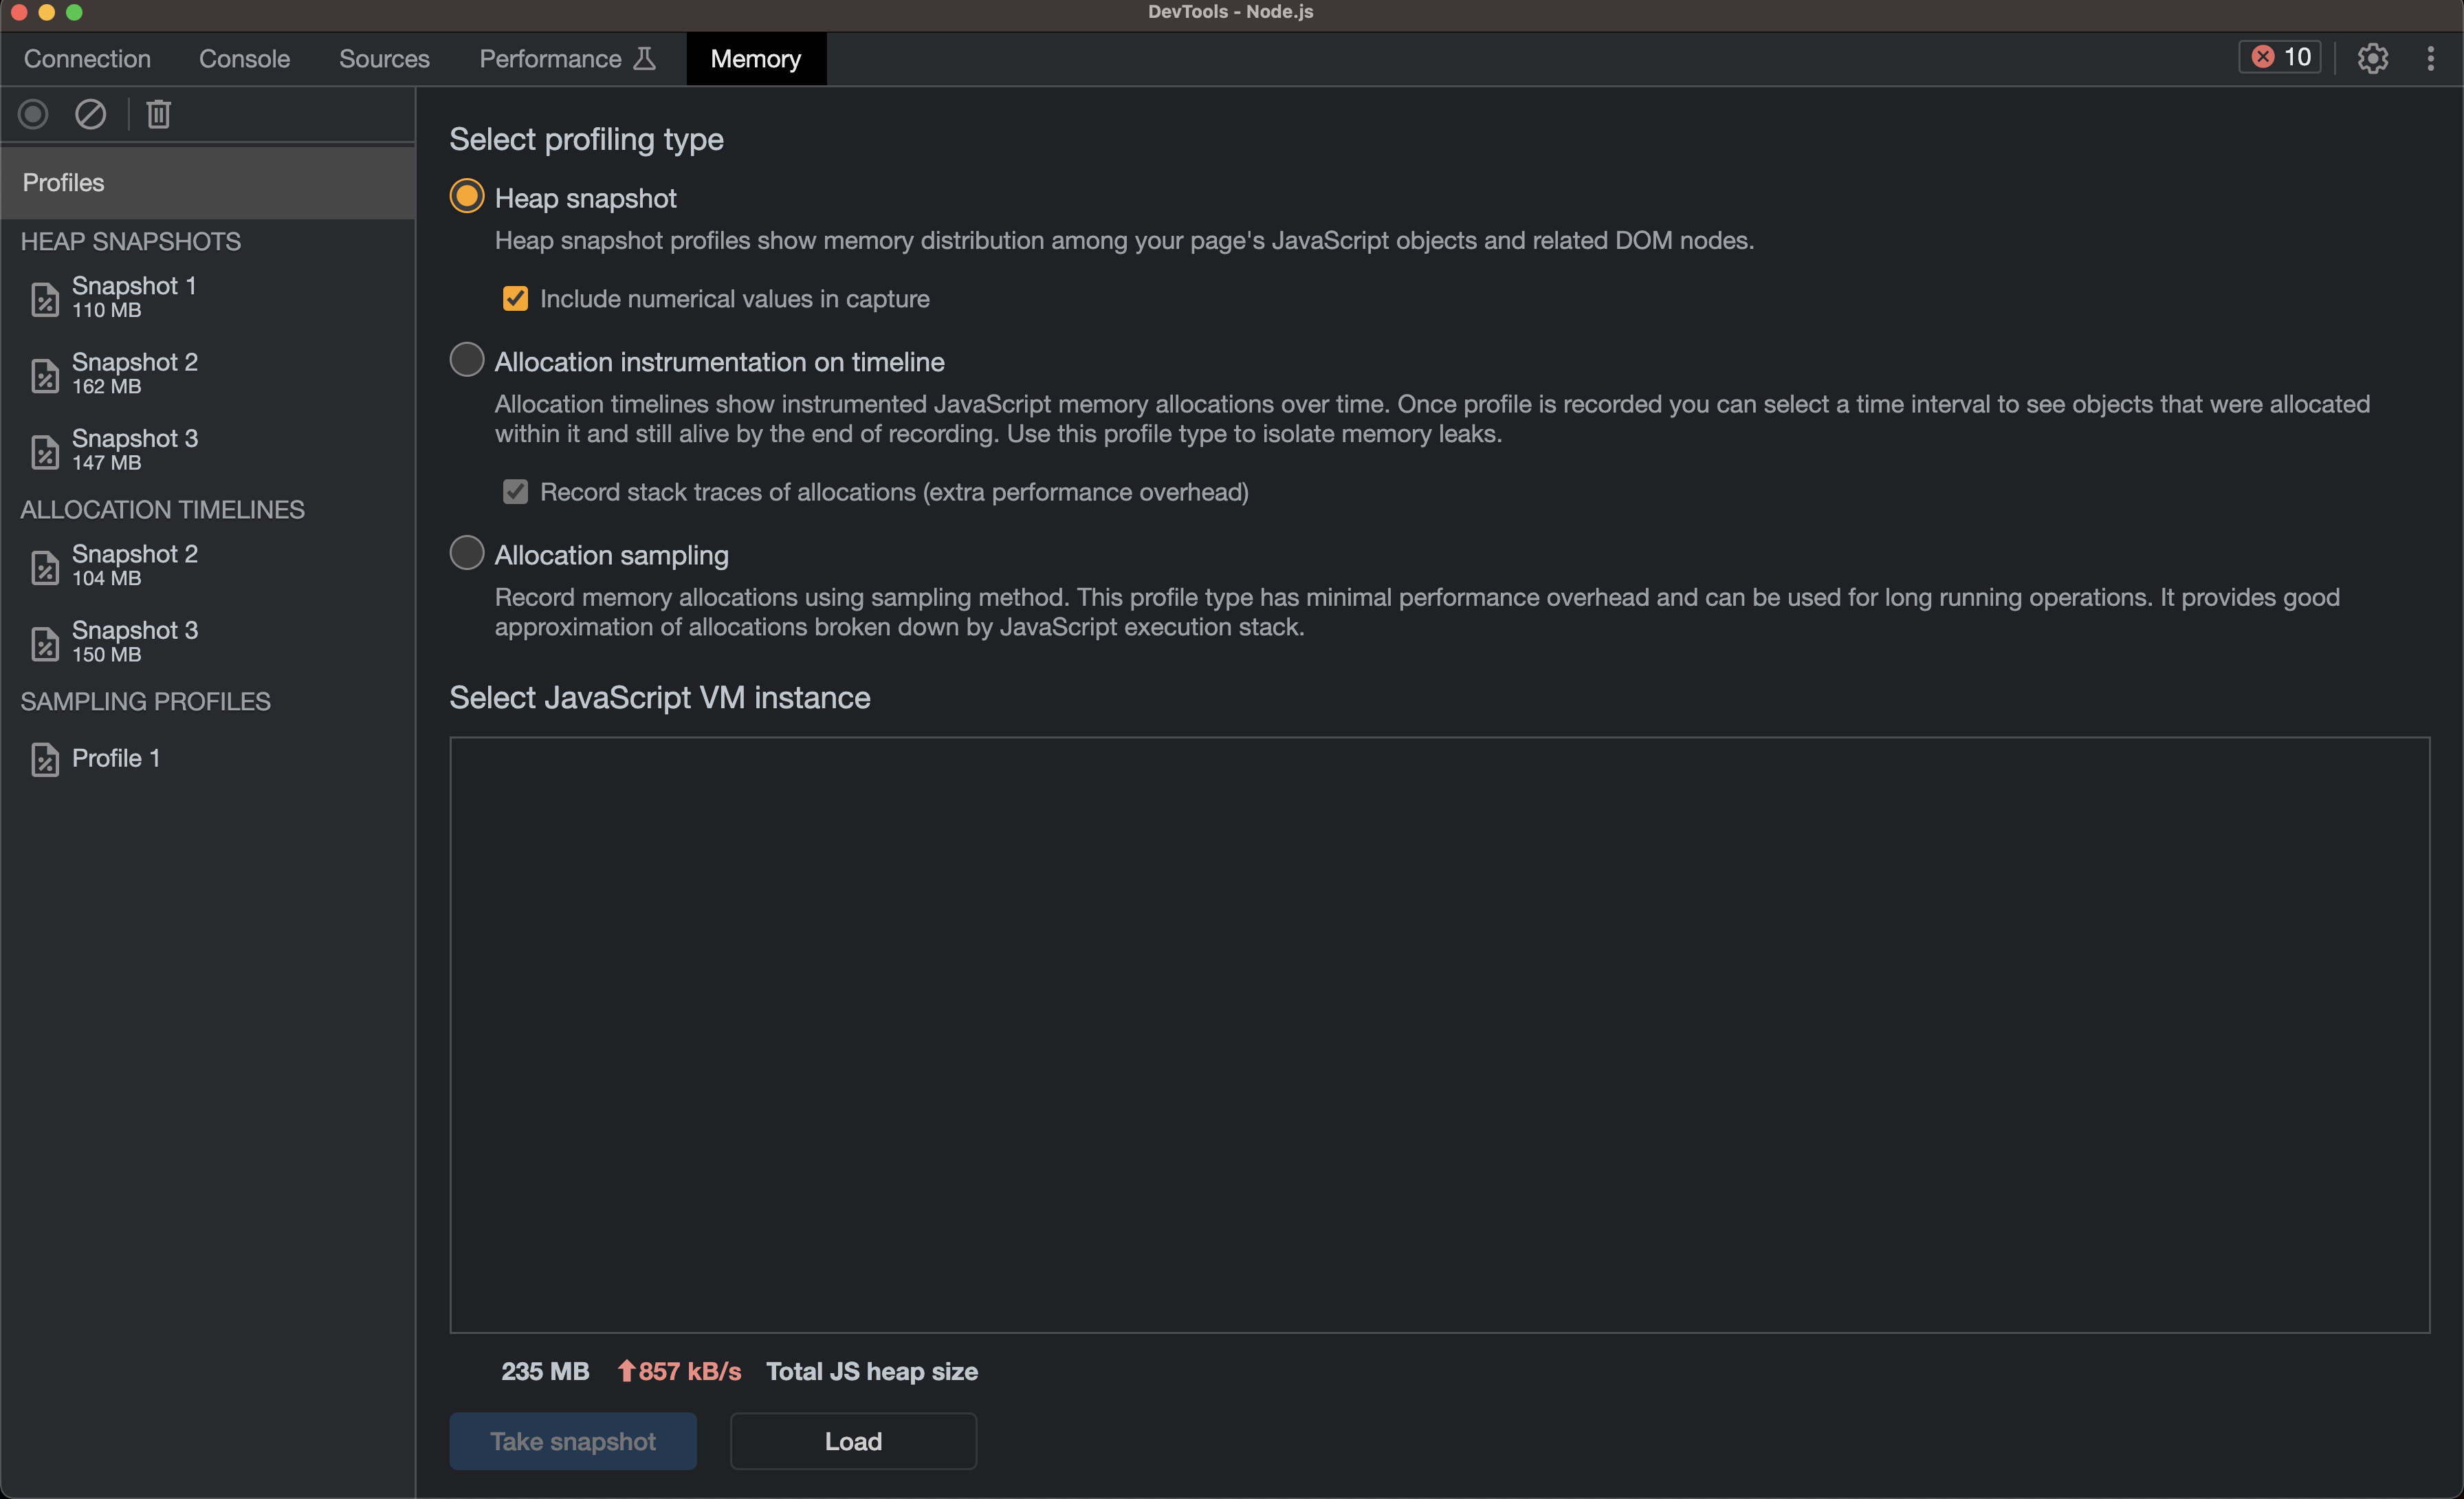
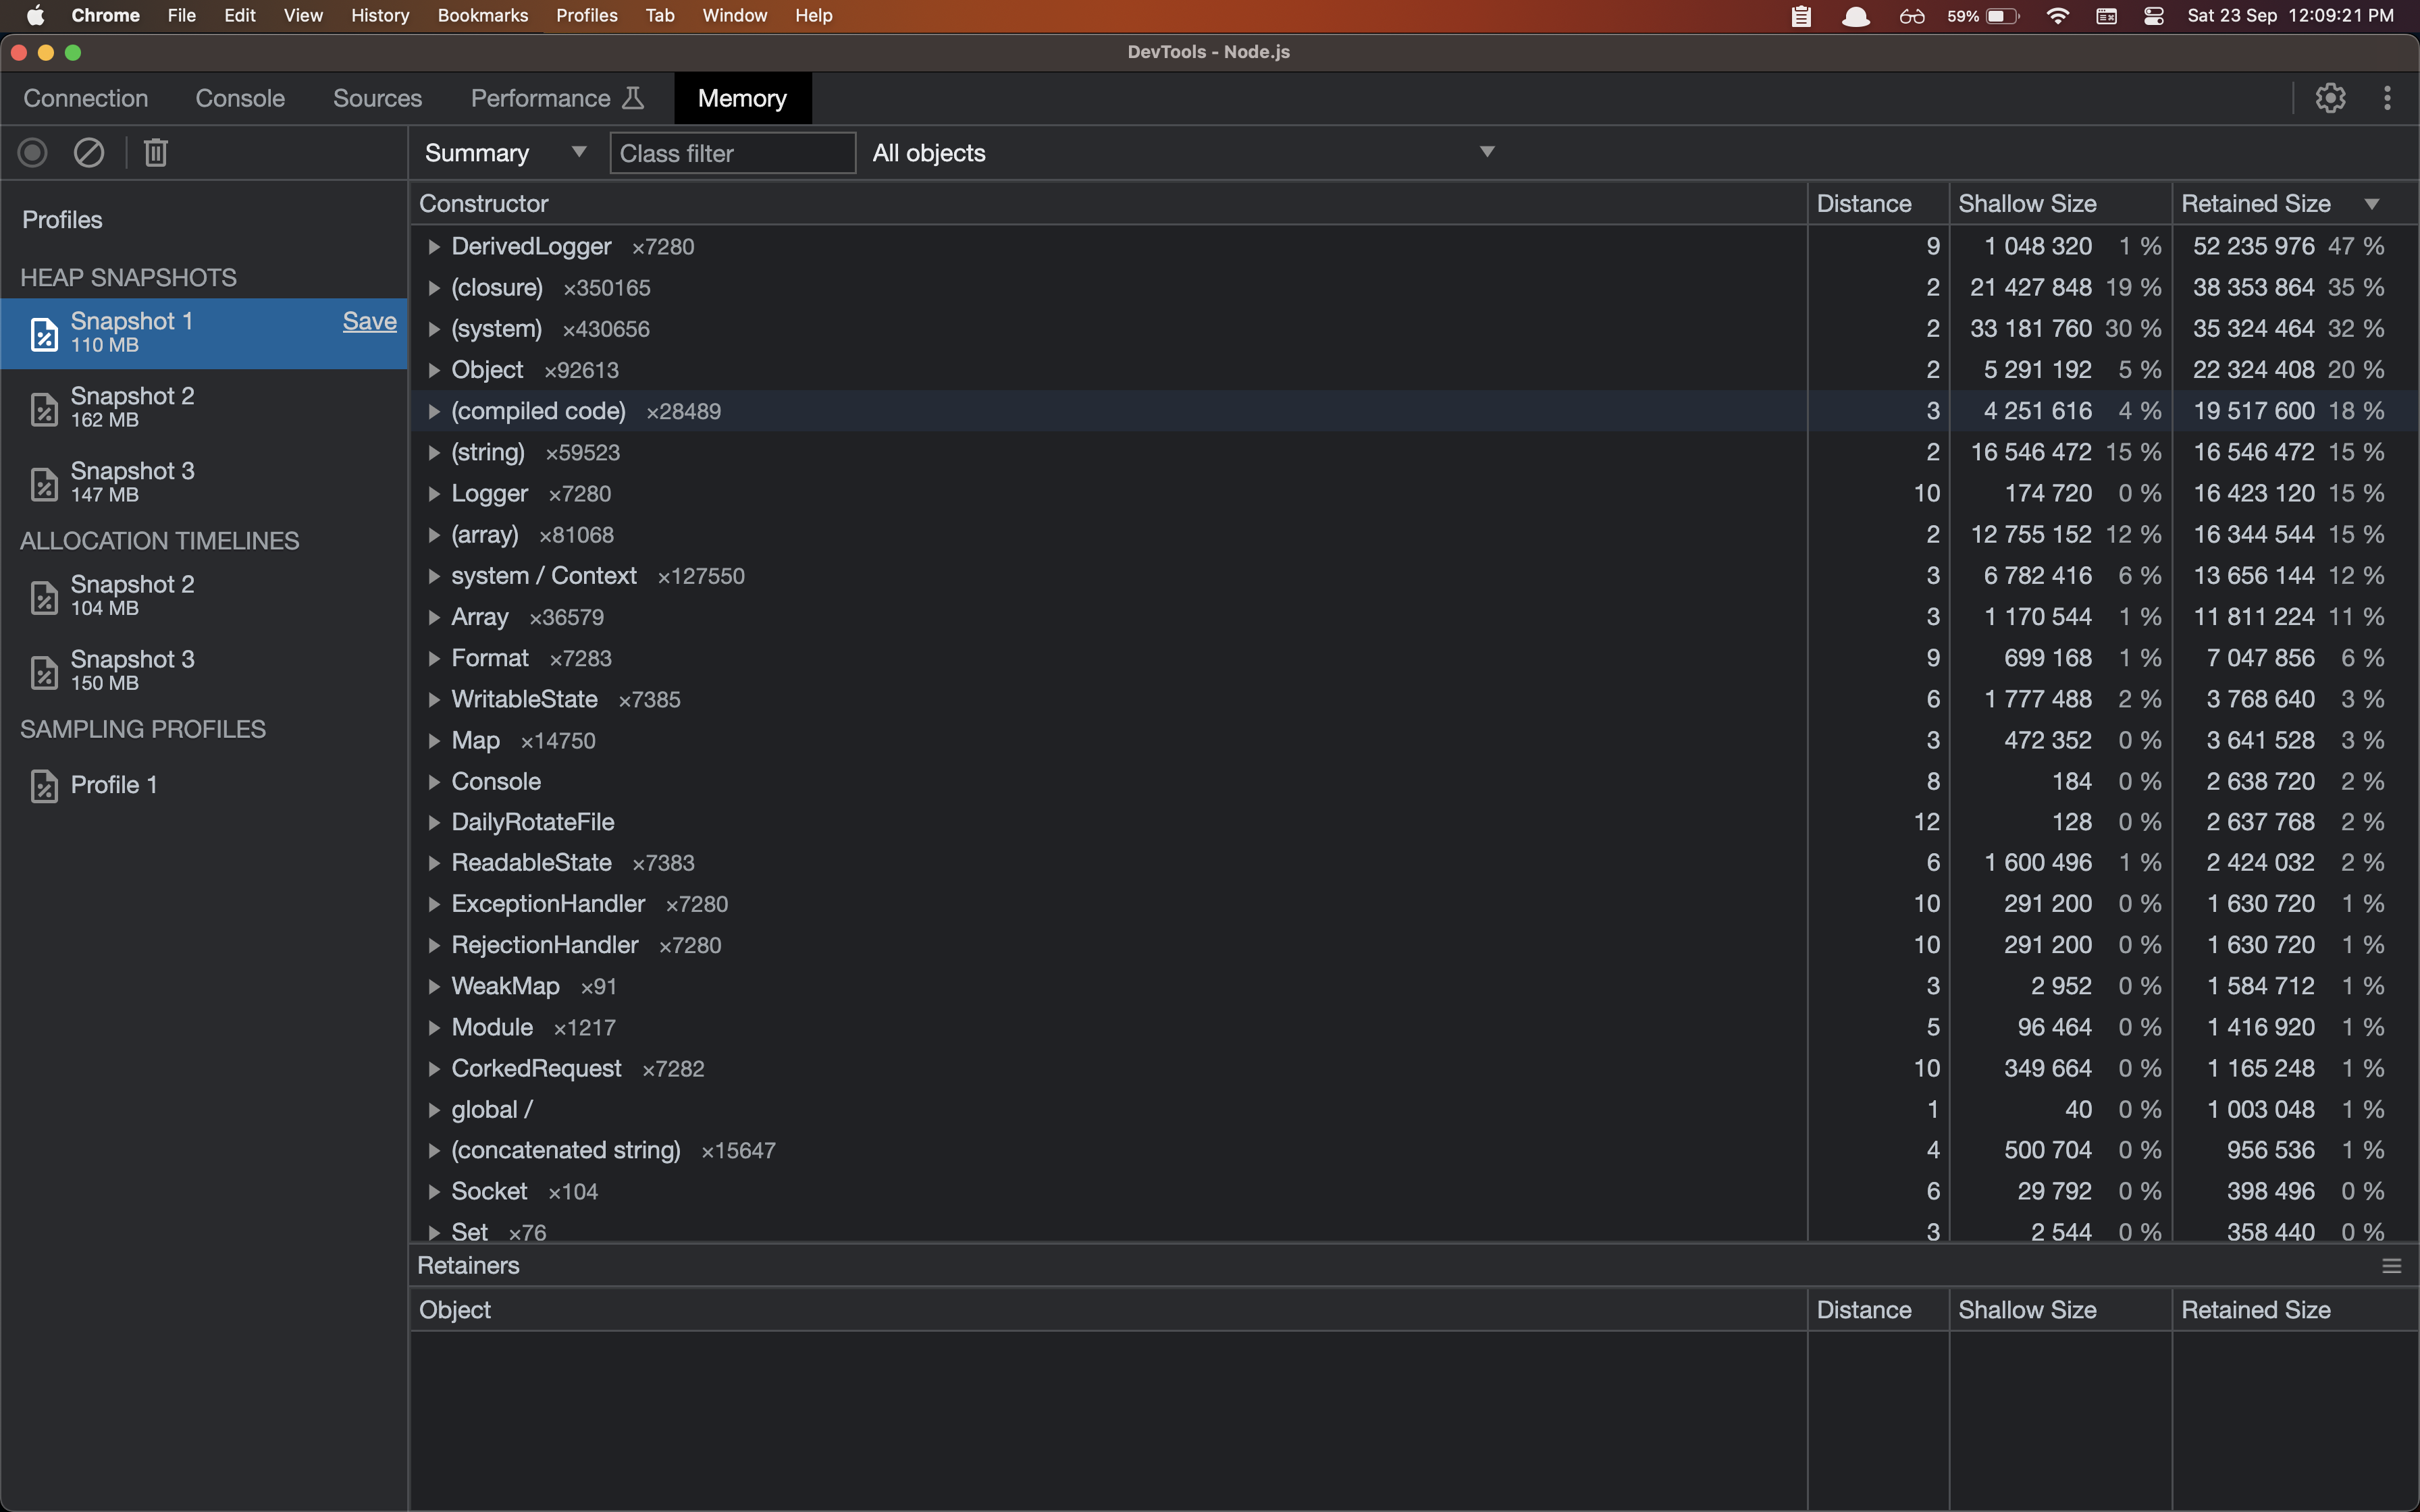
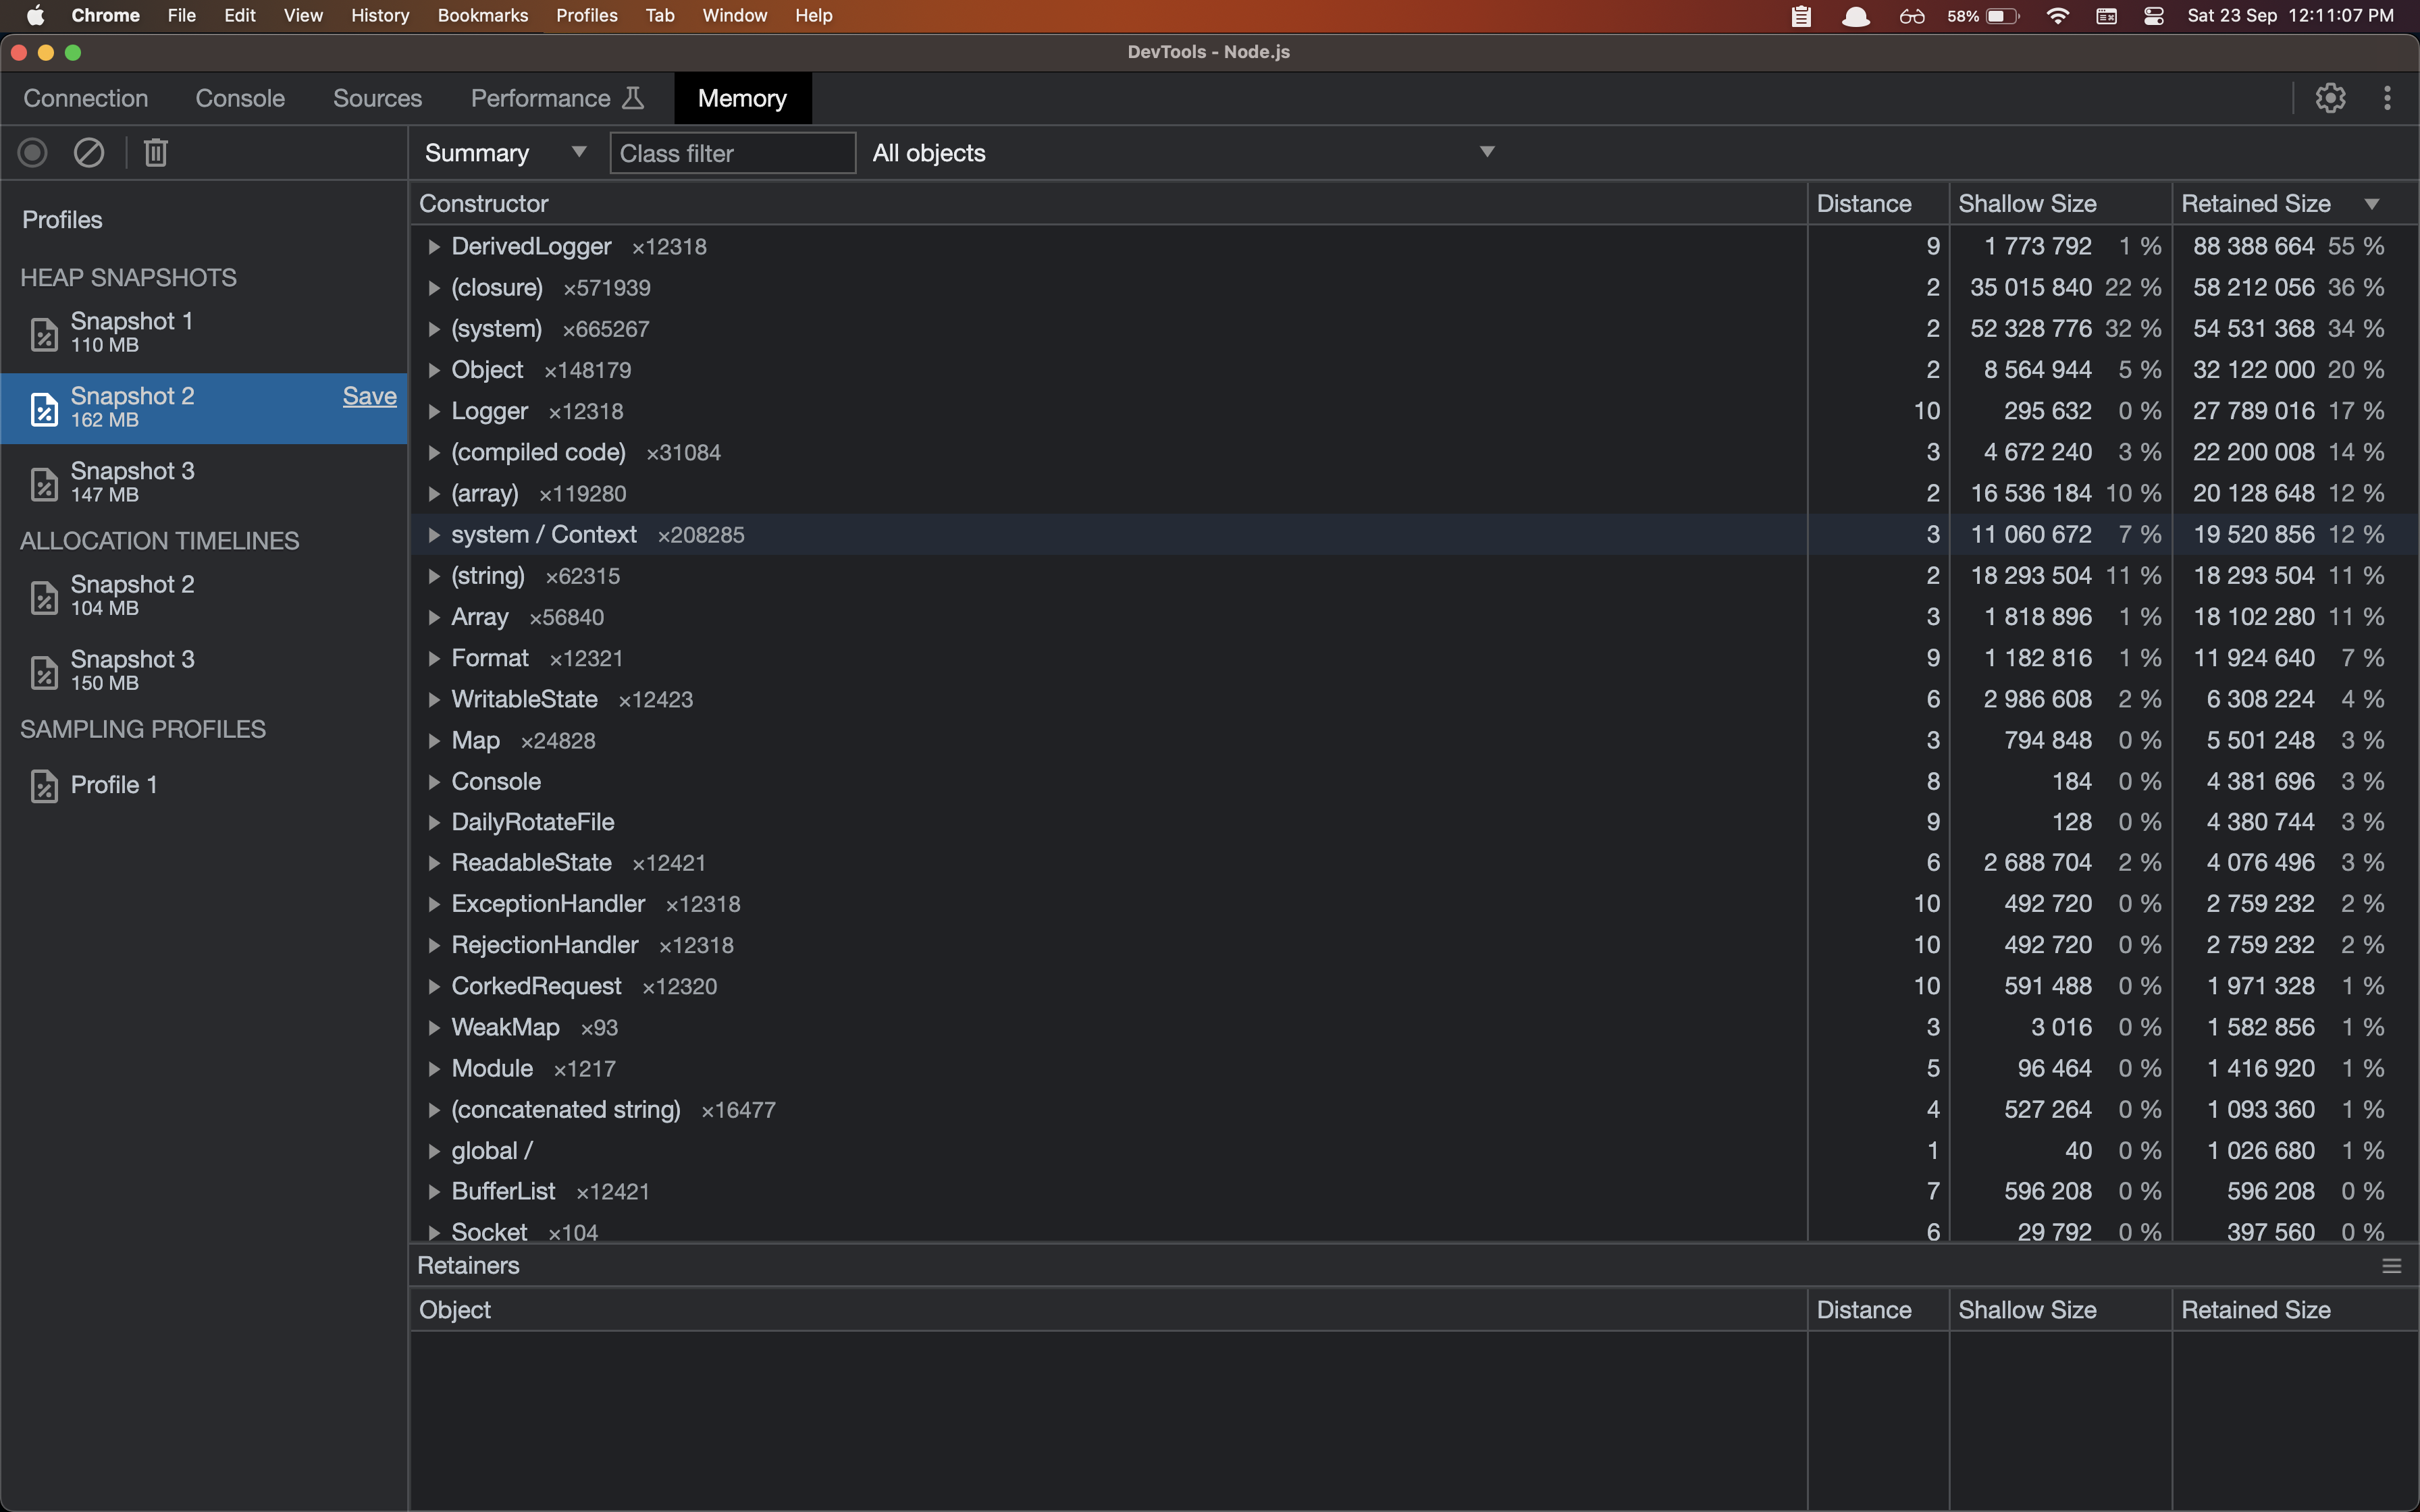
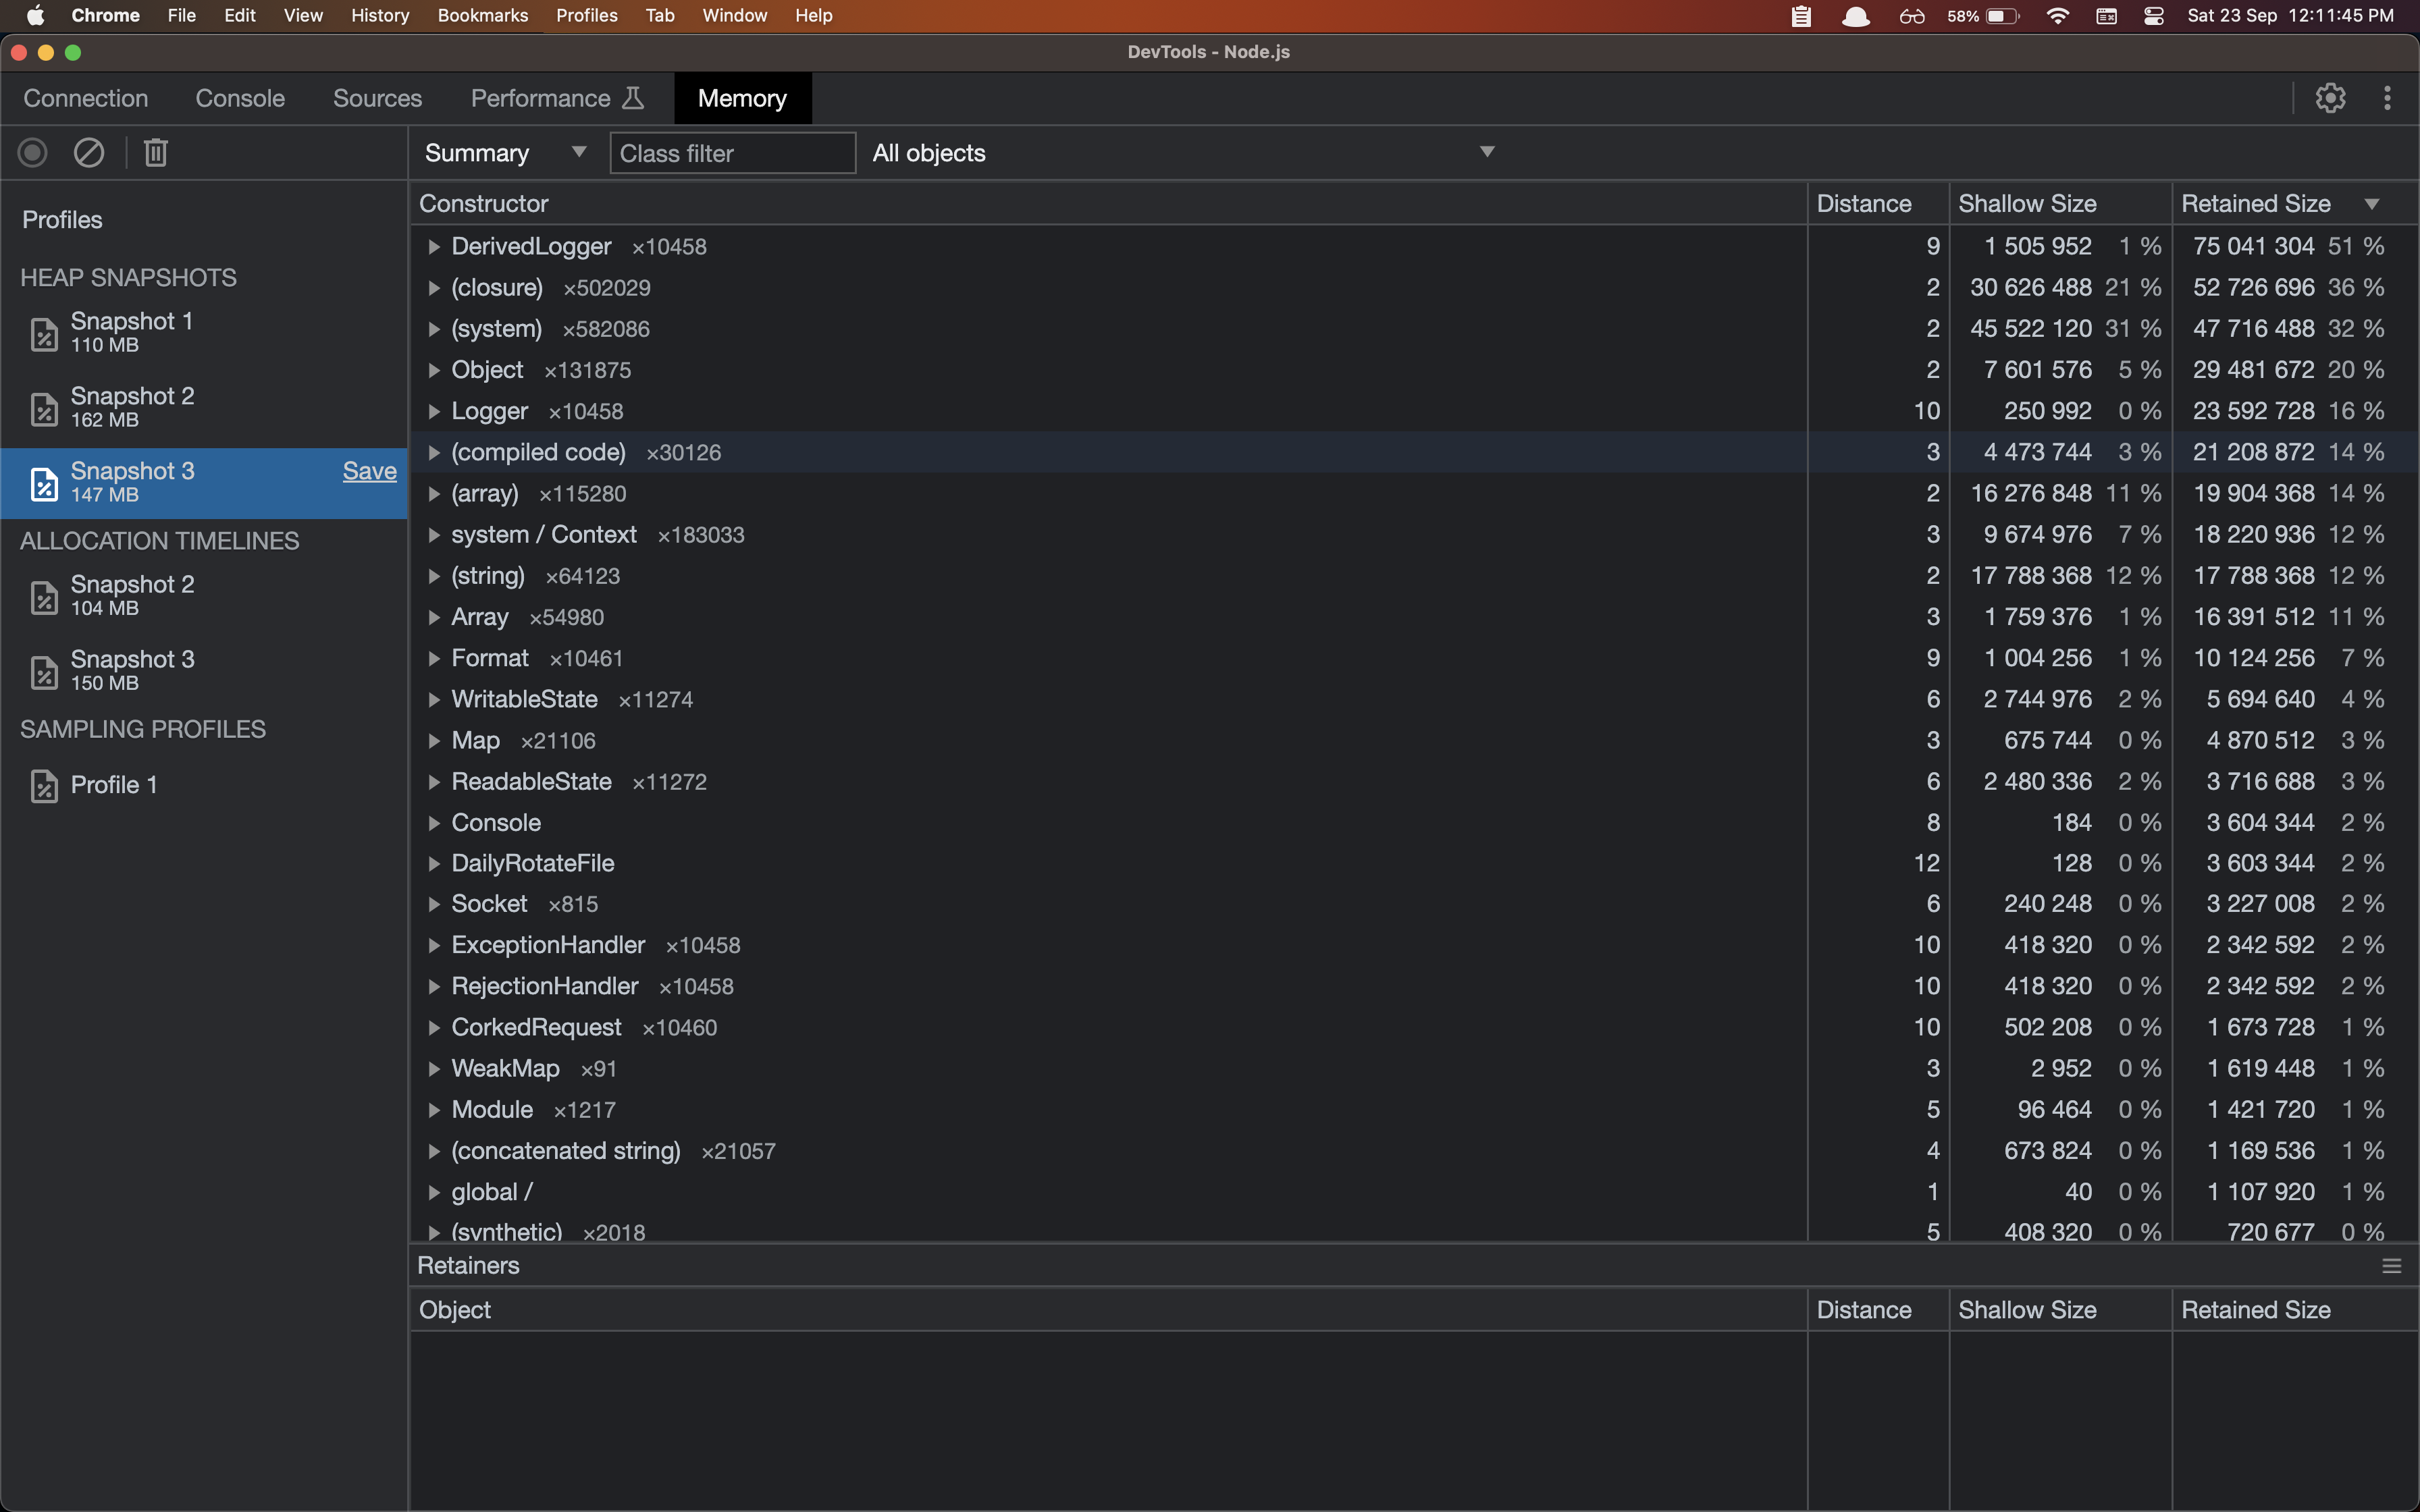
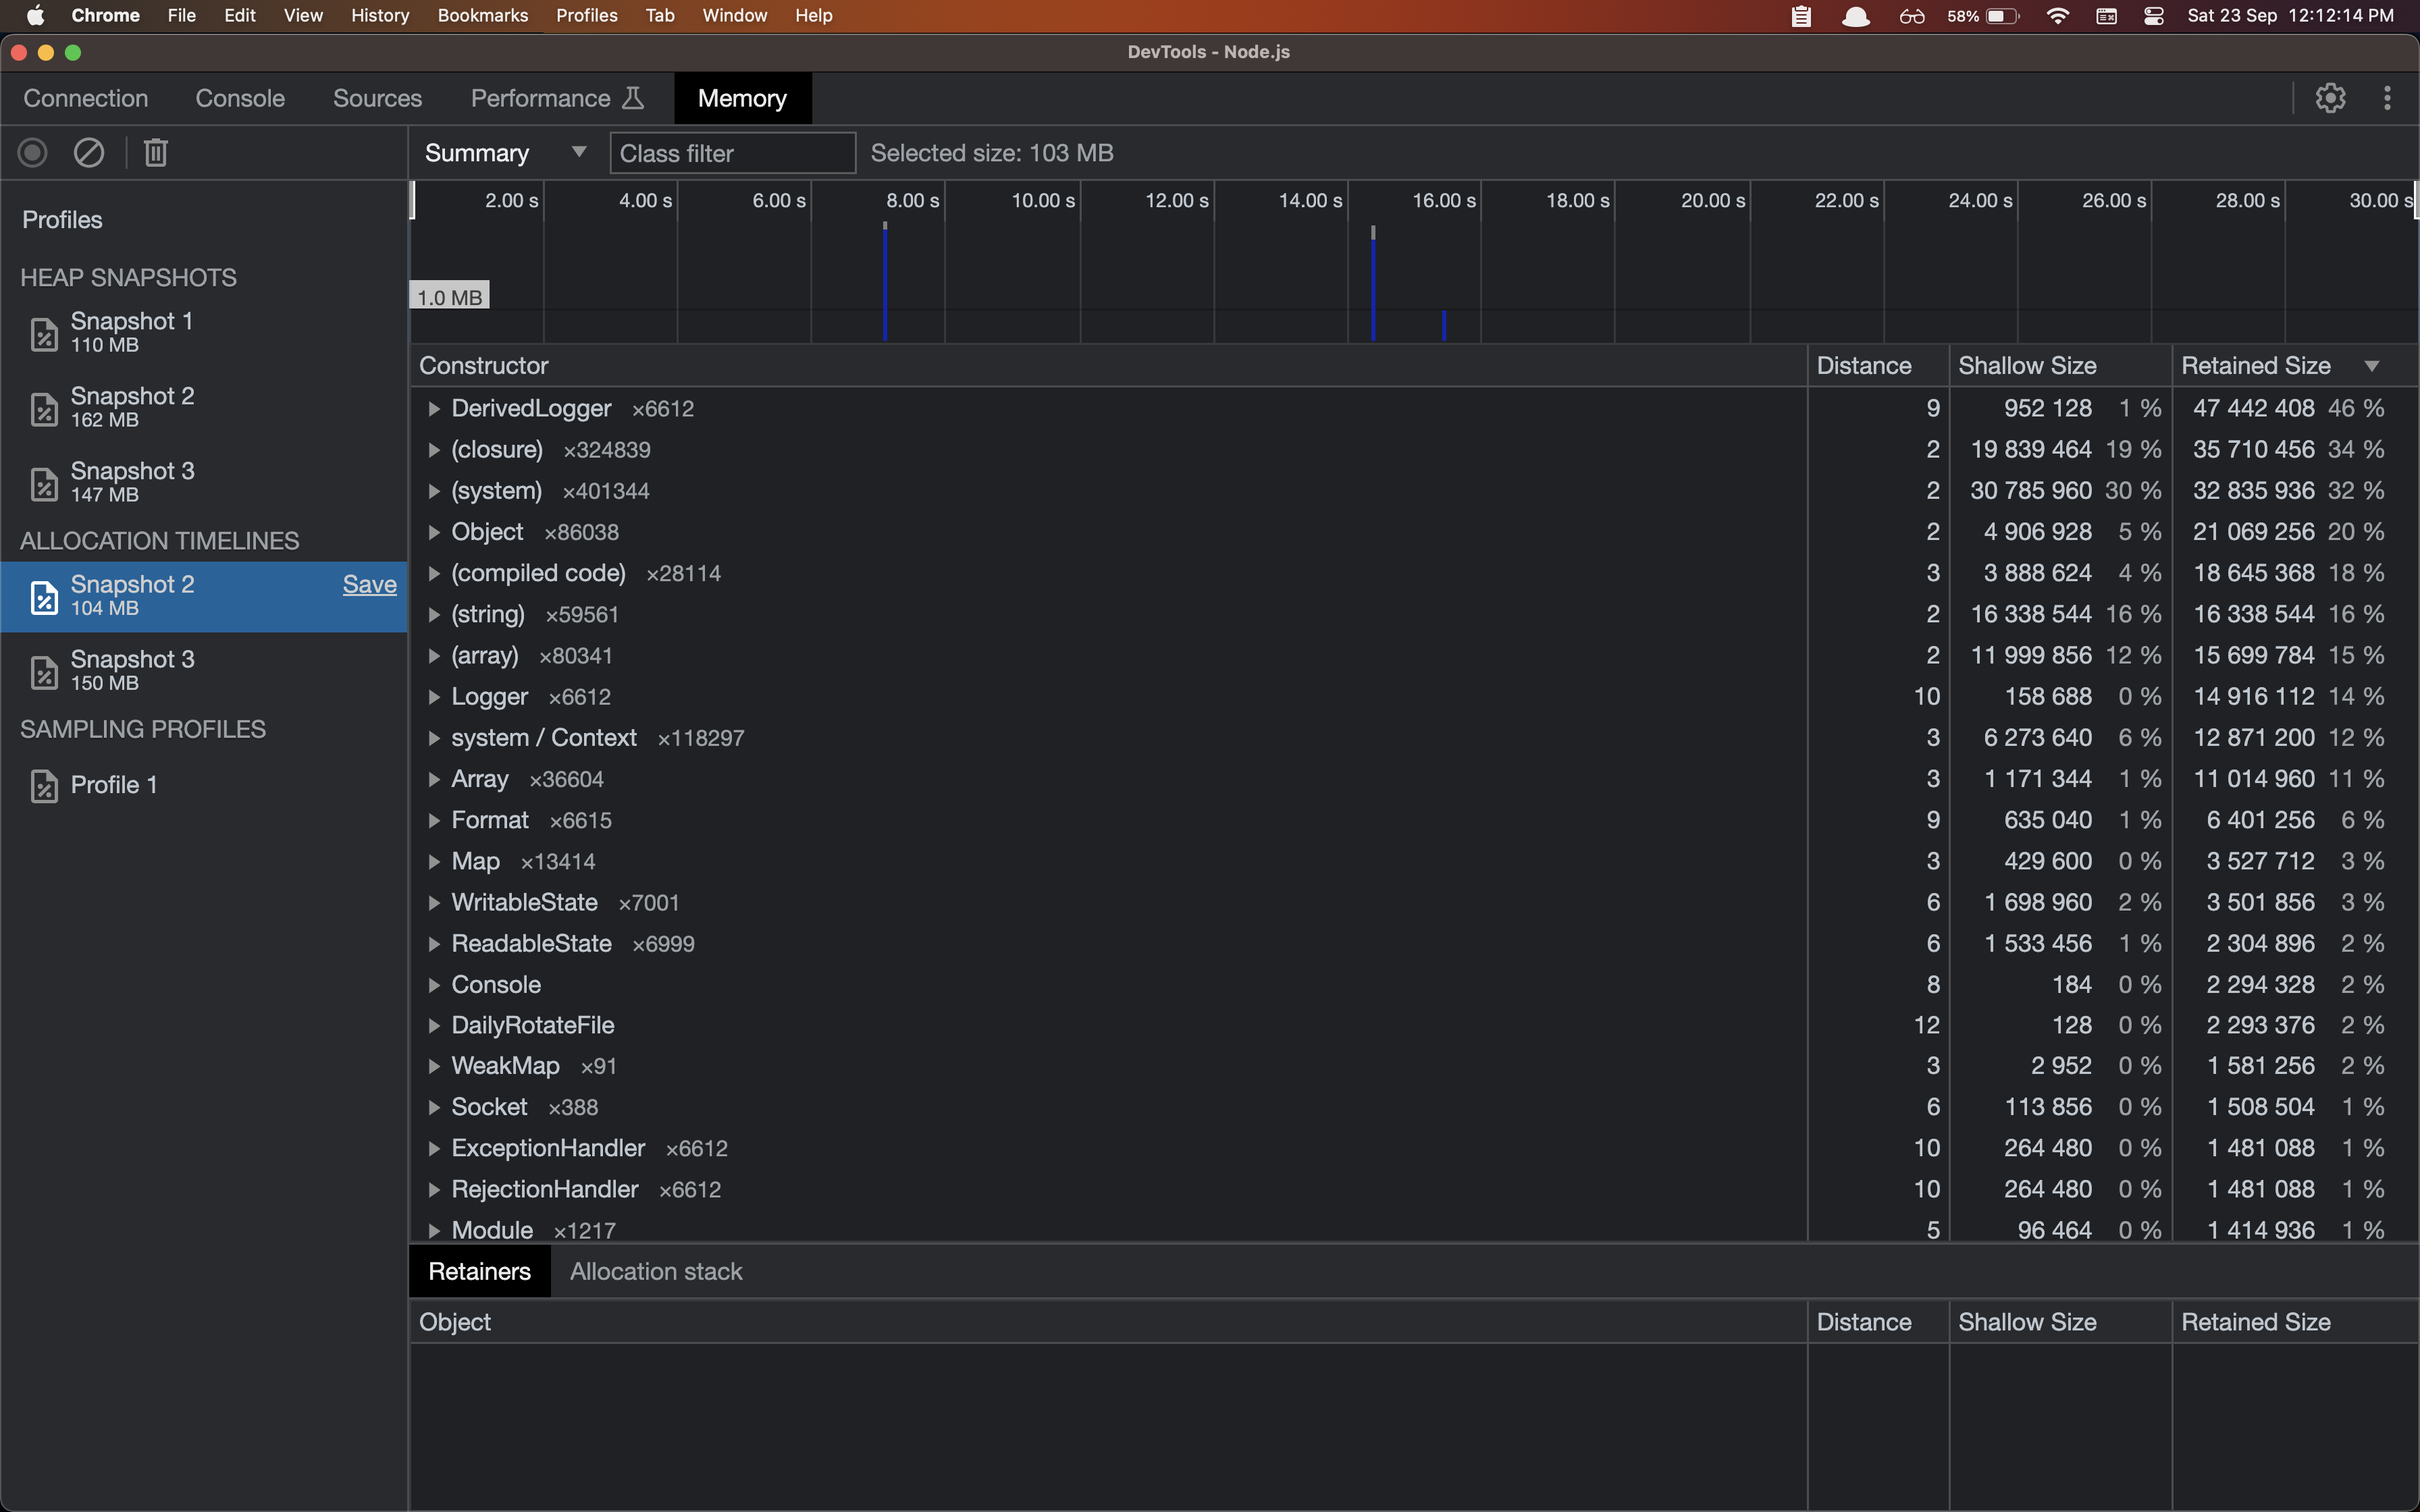
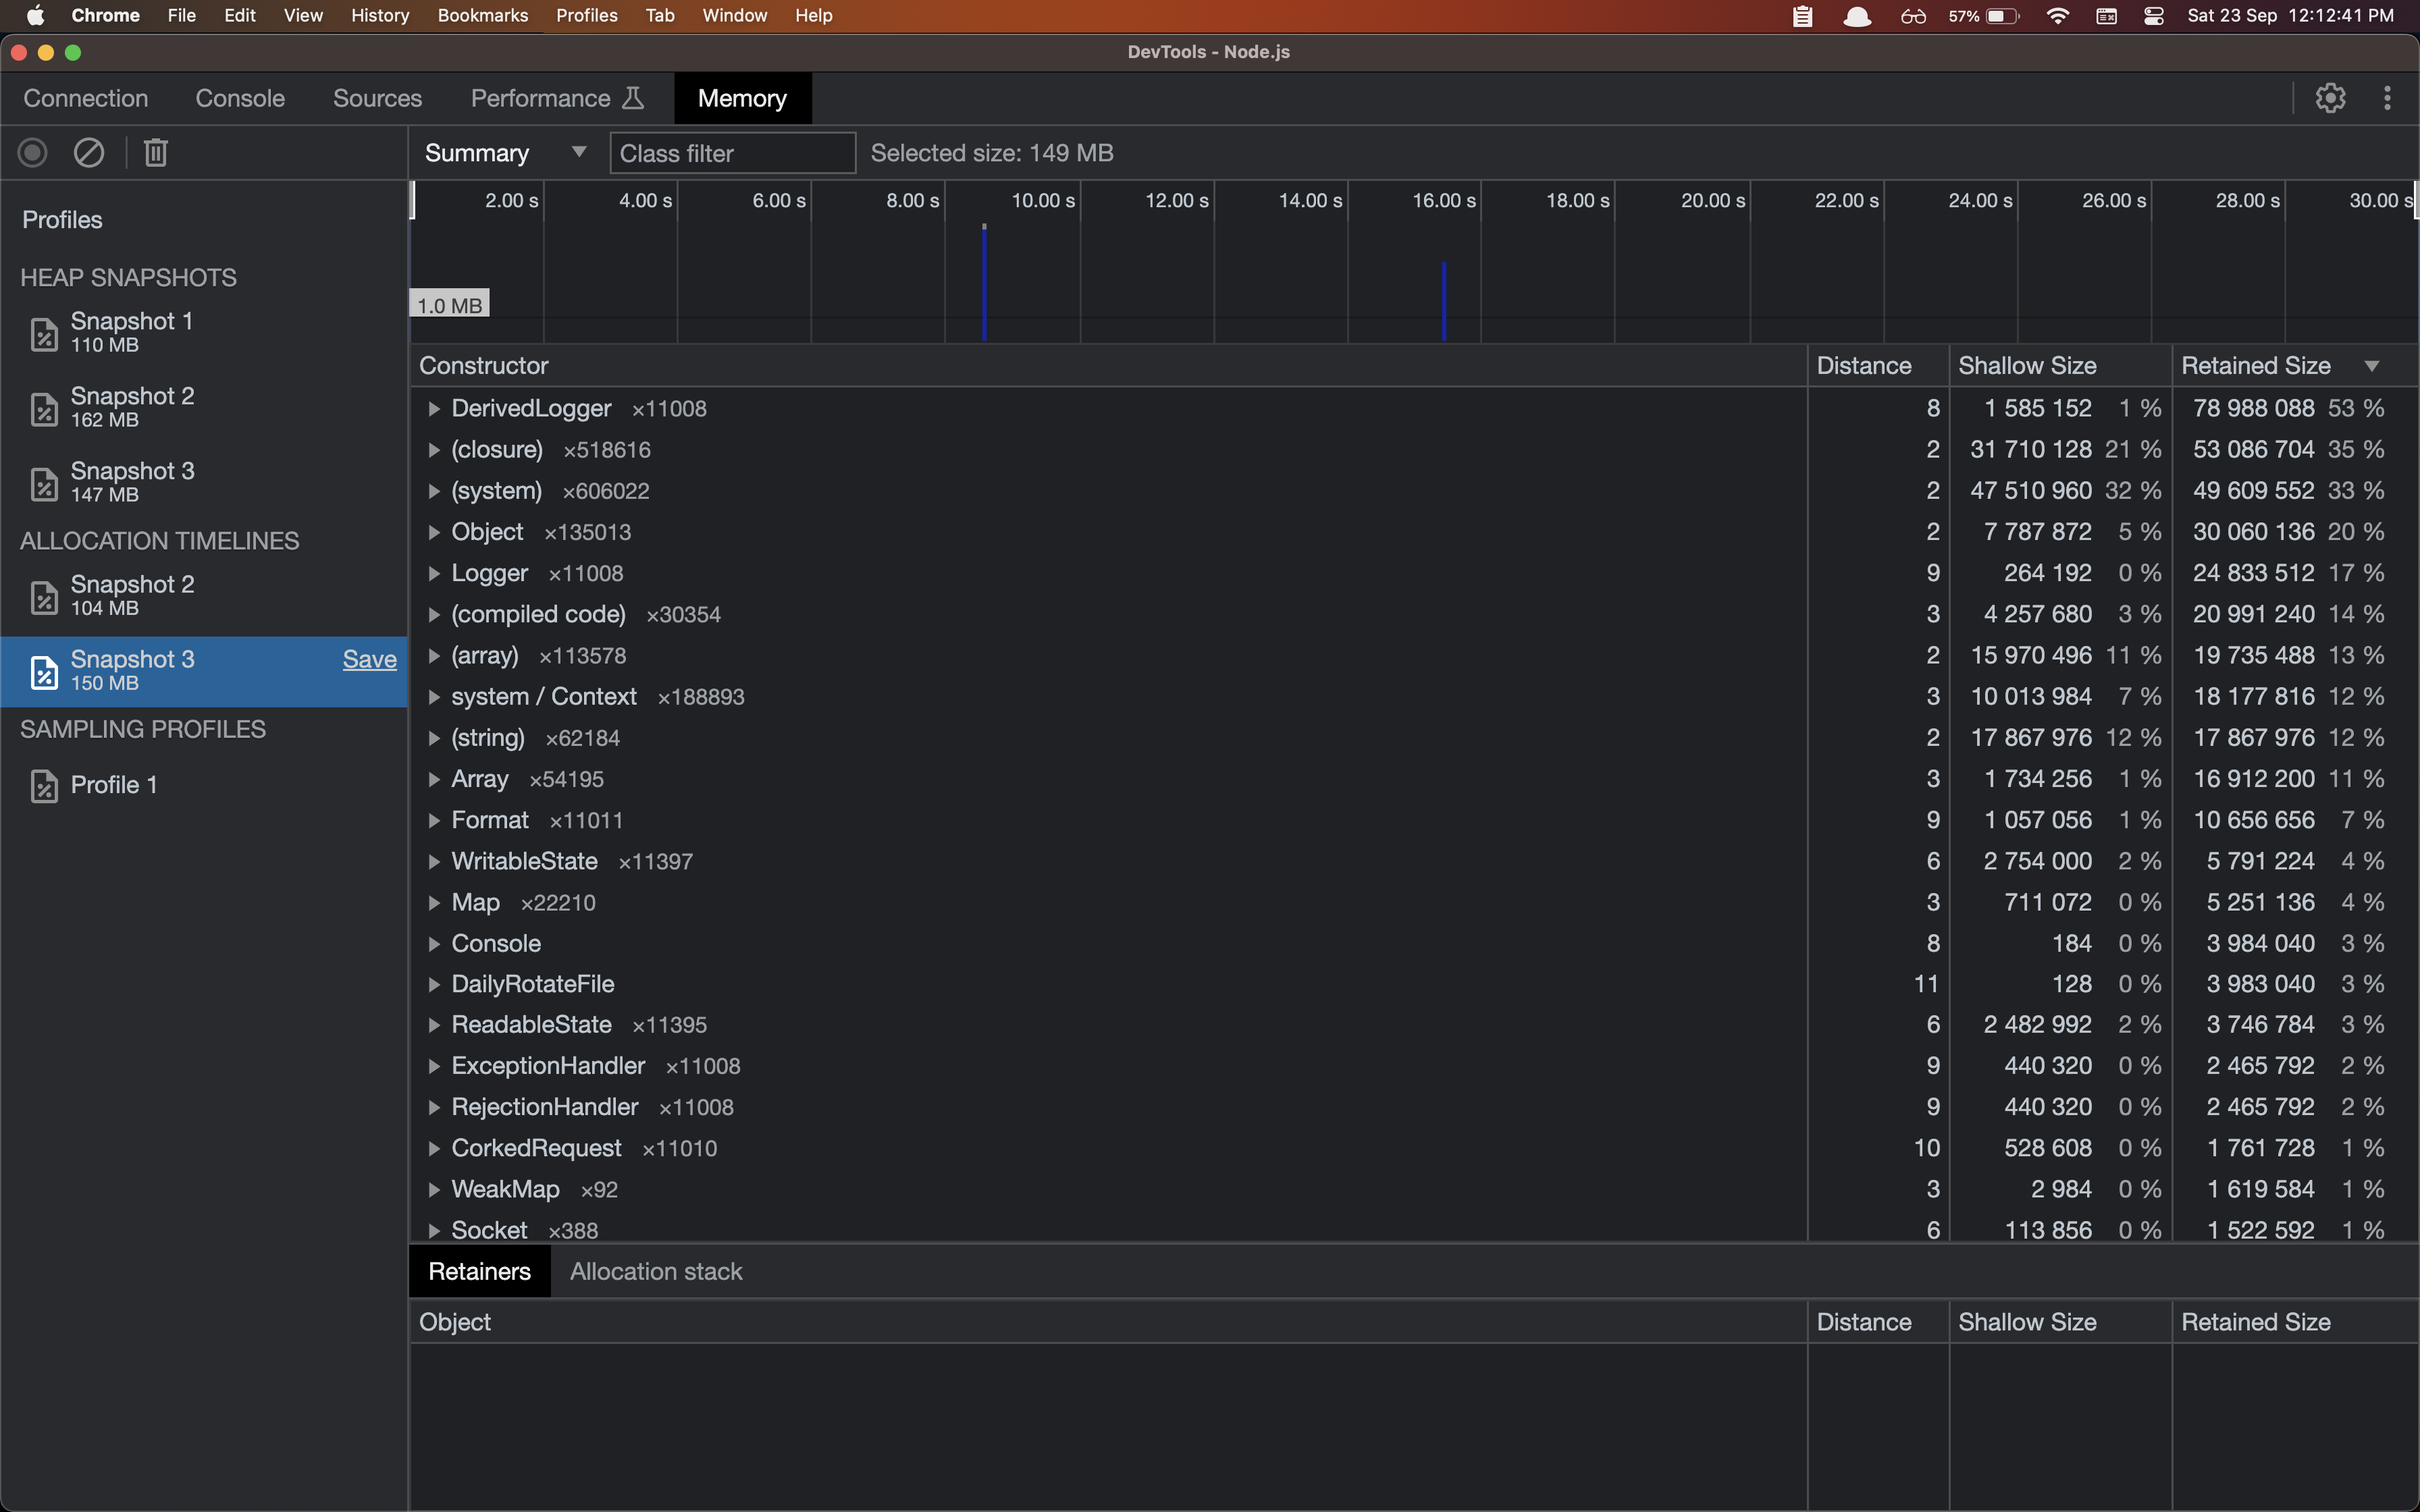
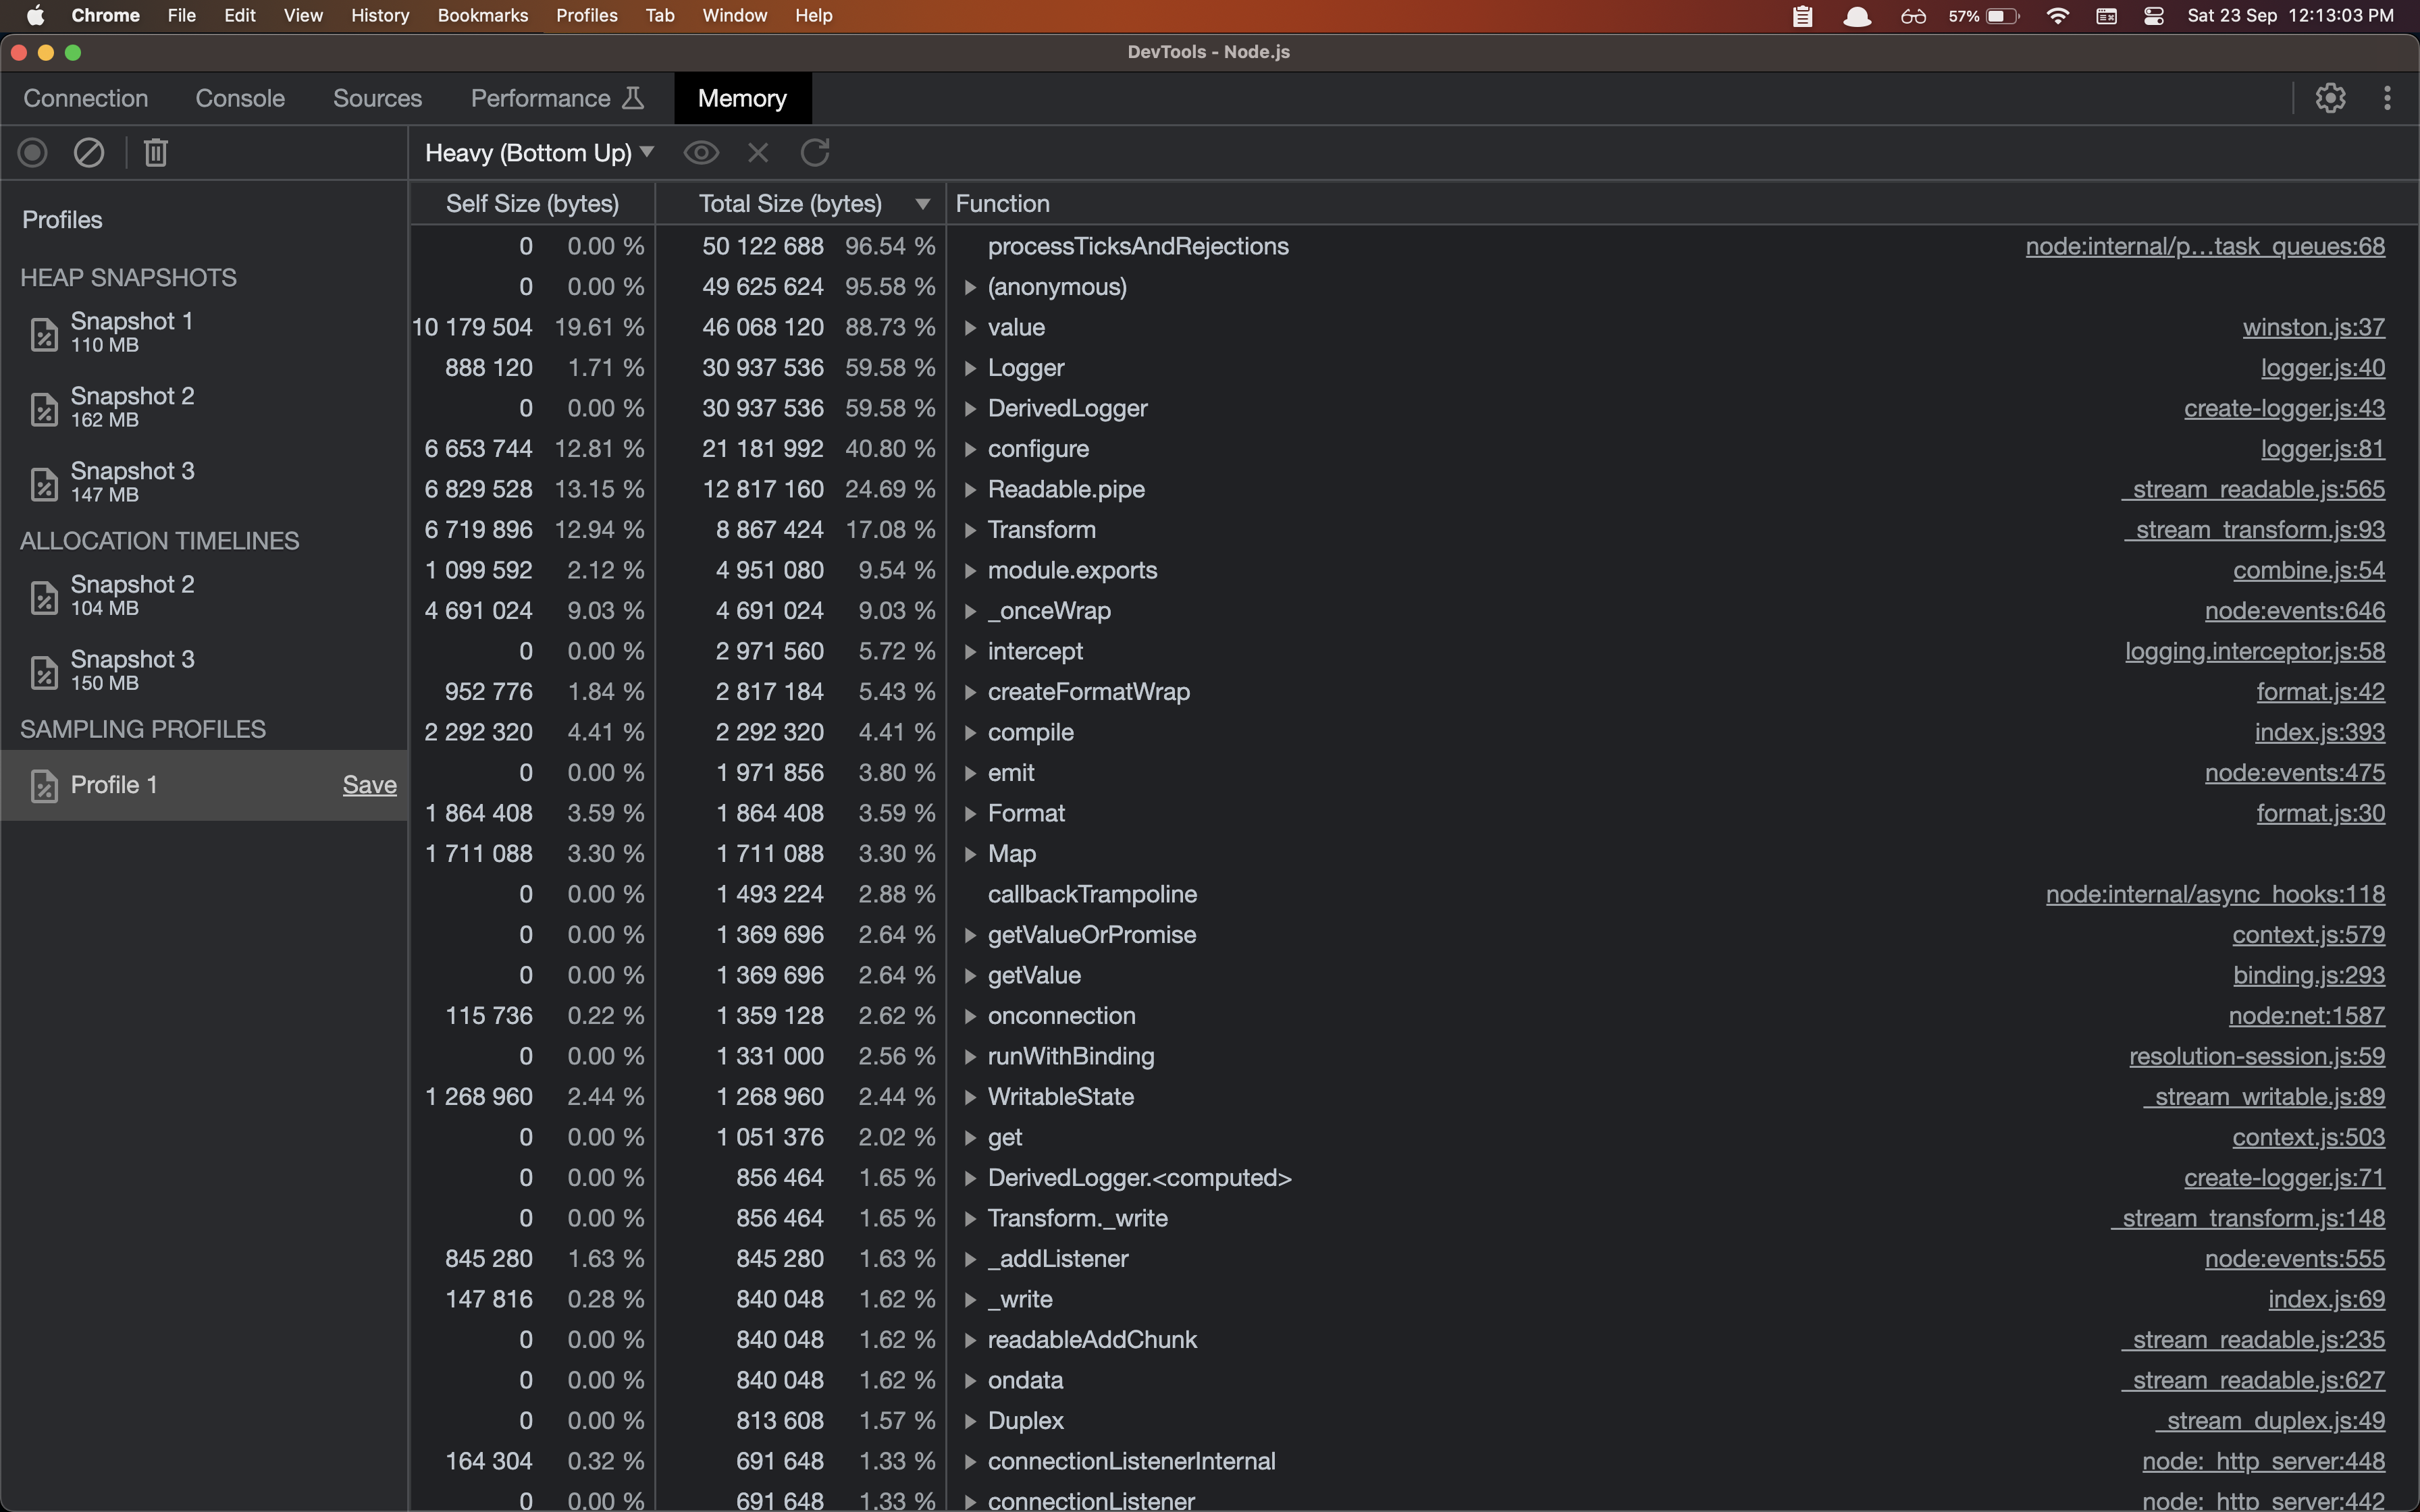
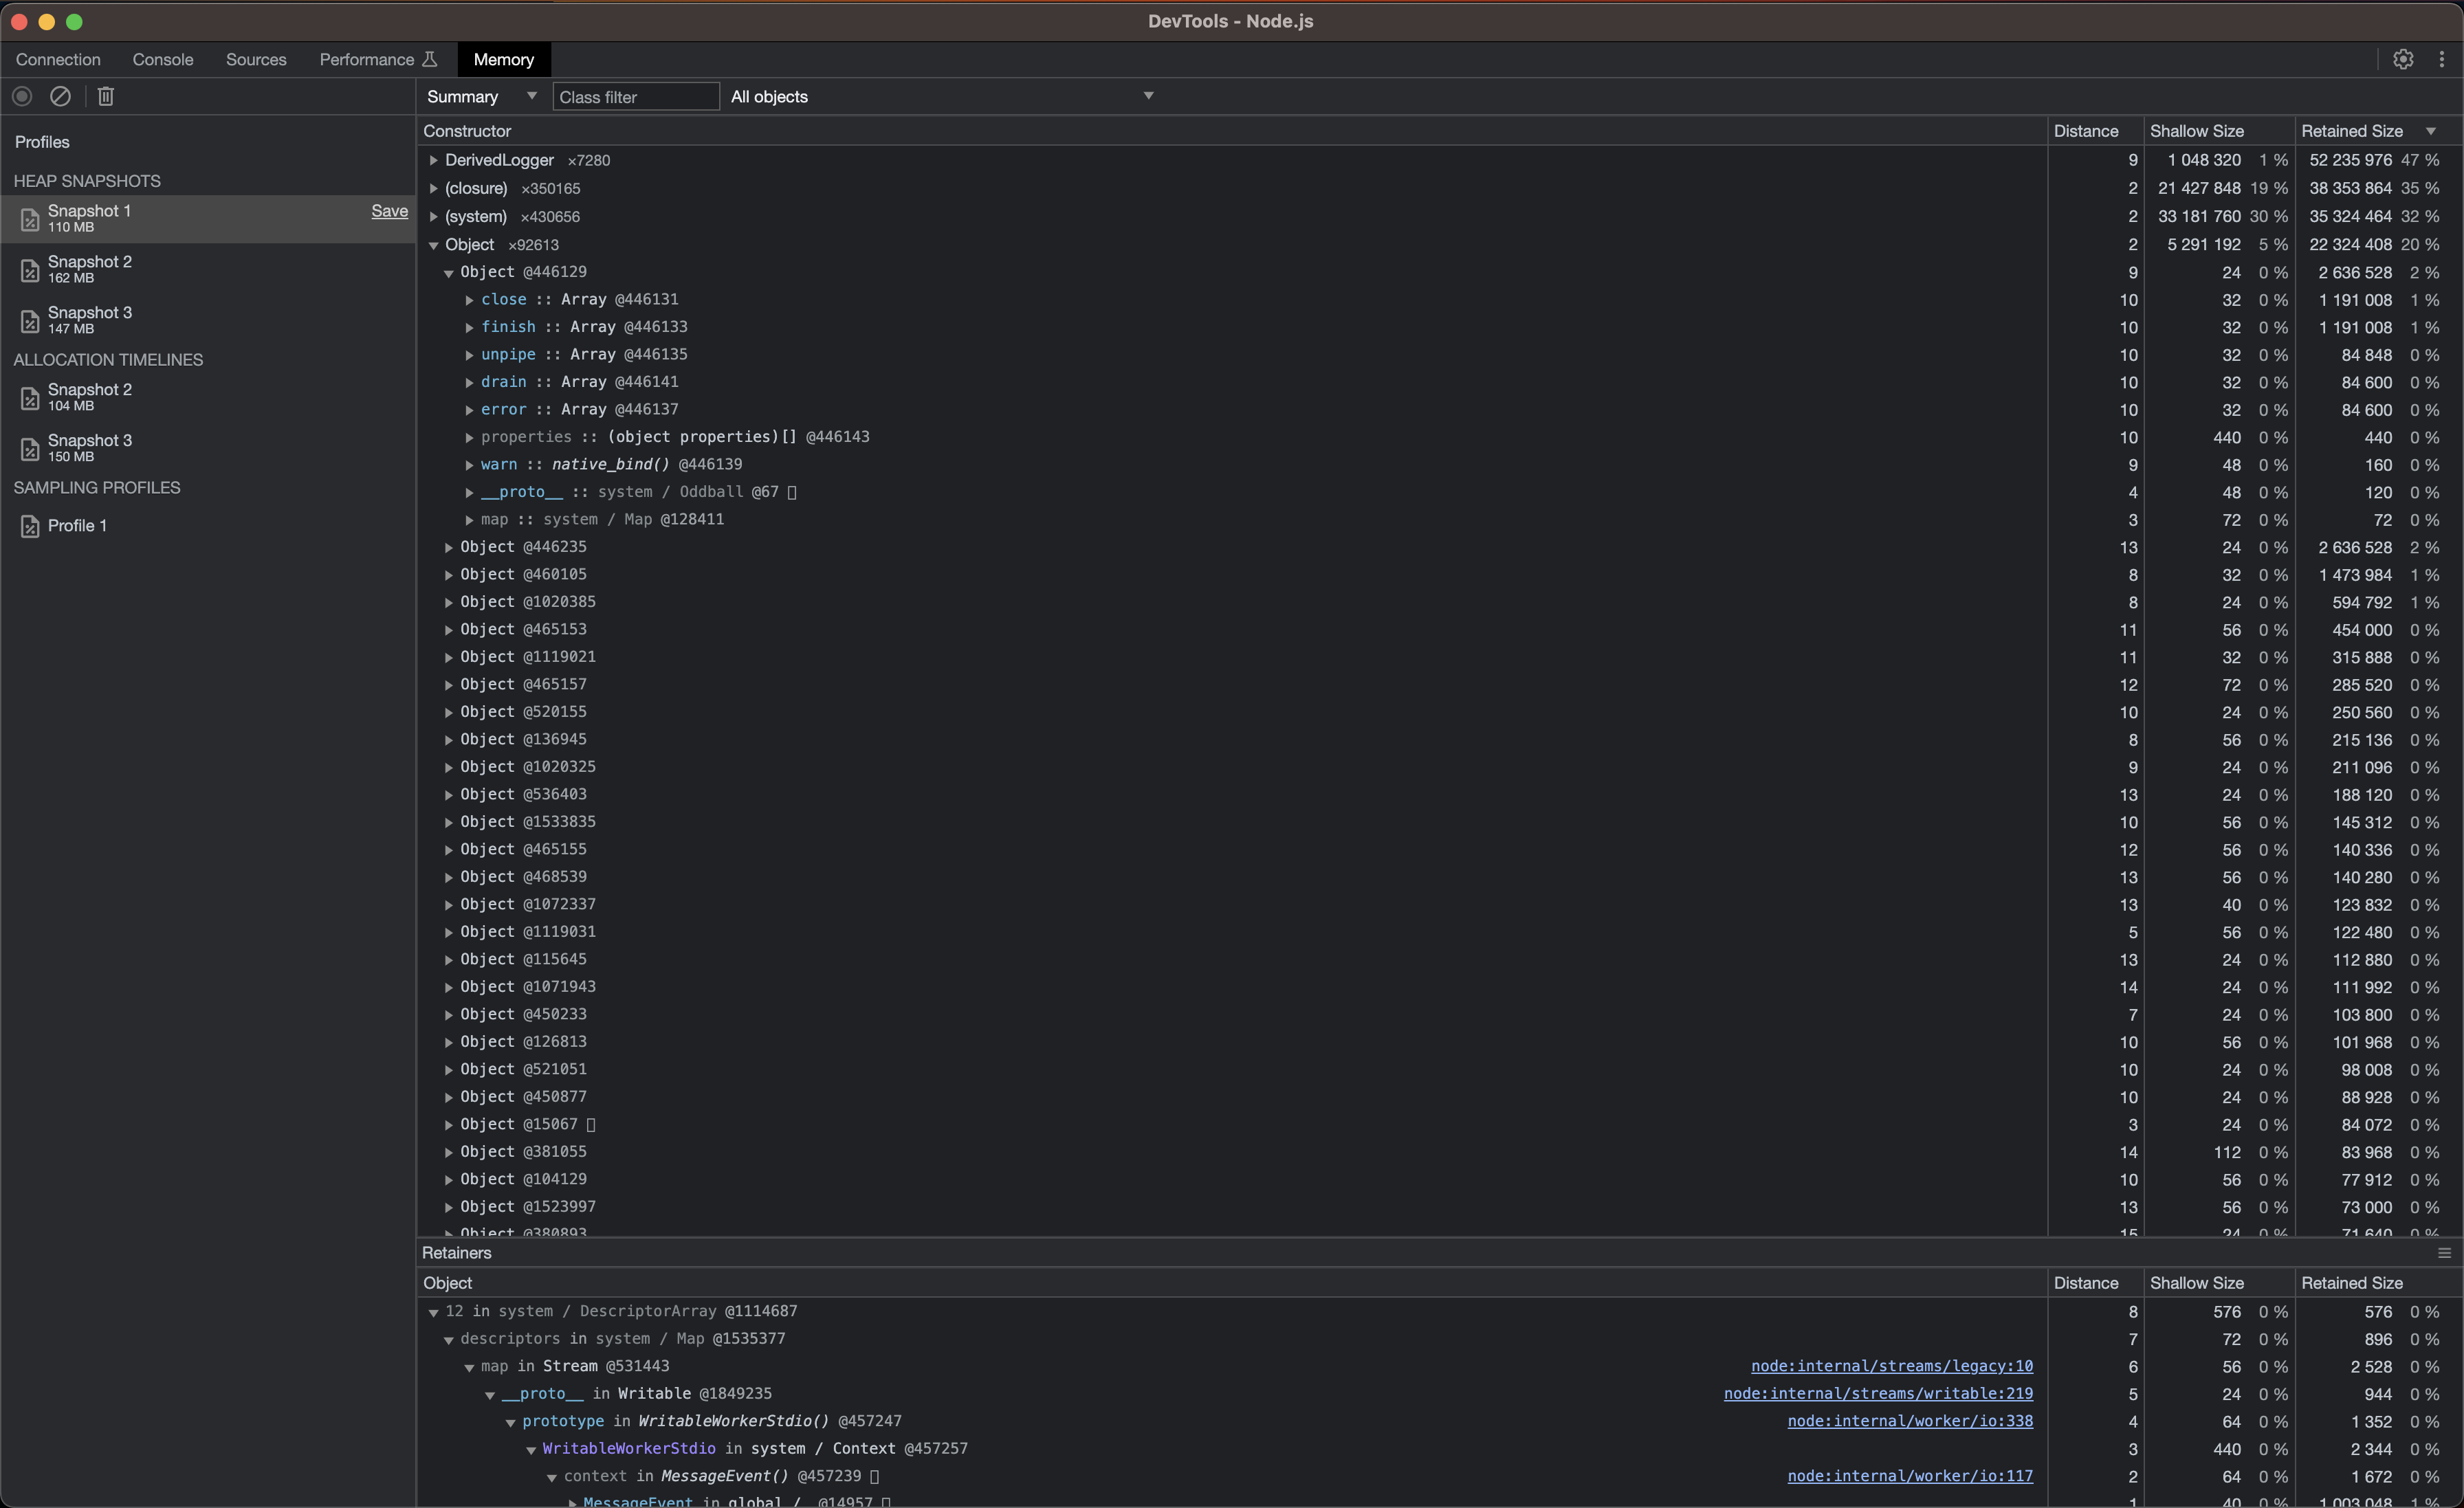
In all the screenshots we can see that there are many Derived Logger constructors and Logger constructors among many other things. All being related to the memory issue. There are also more constructors, for example the Object constructor. I think it's a Node.js stream , given it has some properties like unpipe etc
An interesting and related stackoverflow question I noticed -
https://stackoverflow.com/questions/9768444/possible-eventemitter-memory-leak-detected
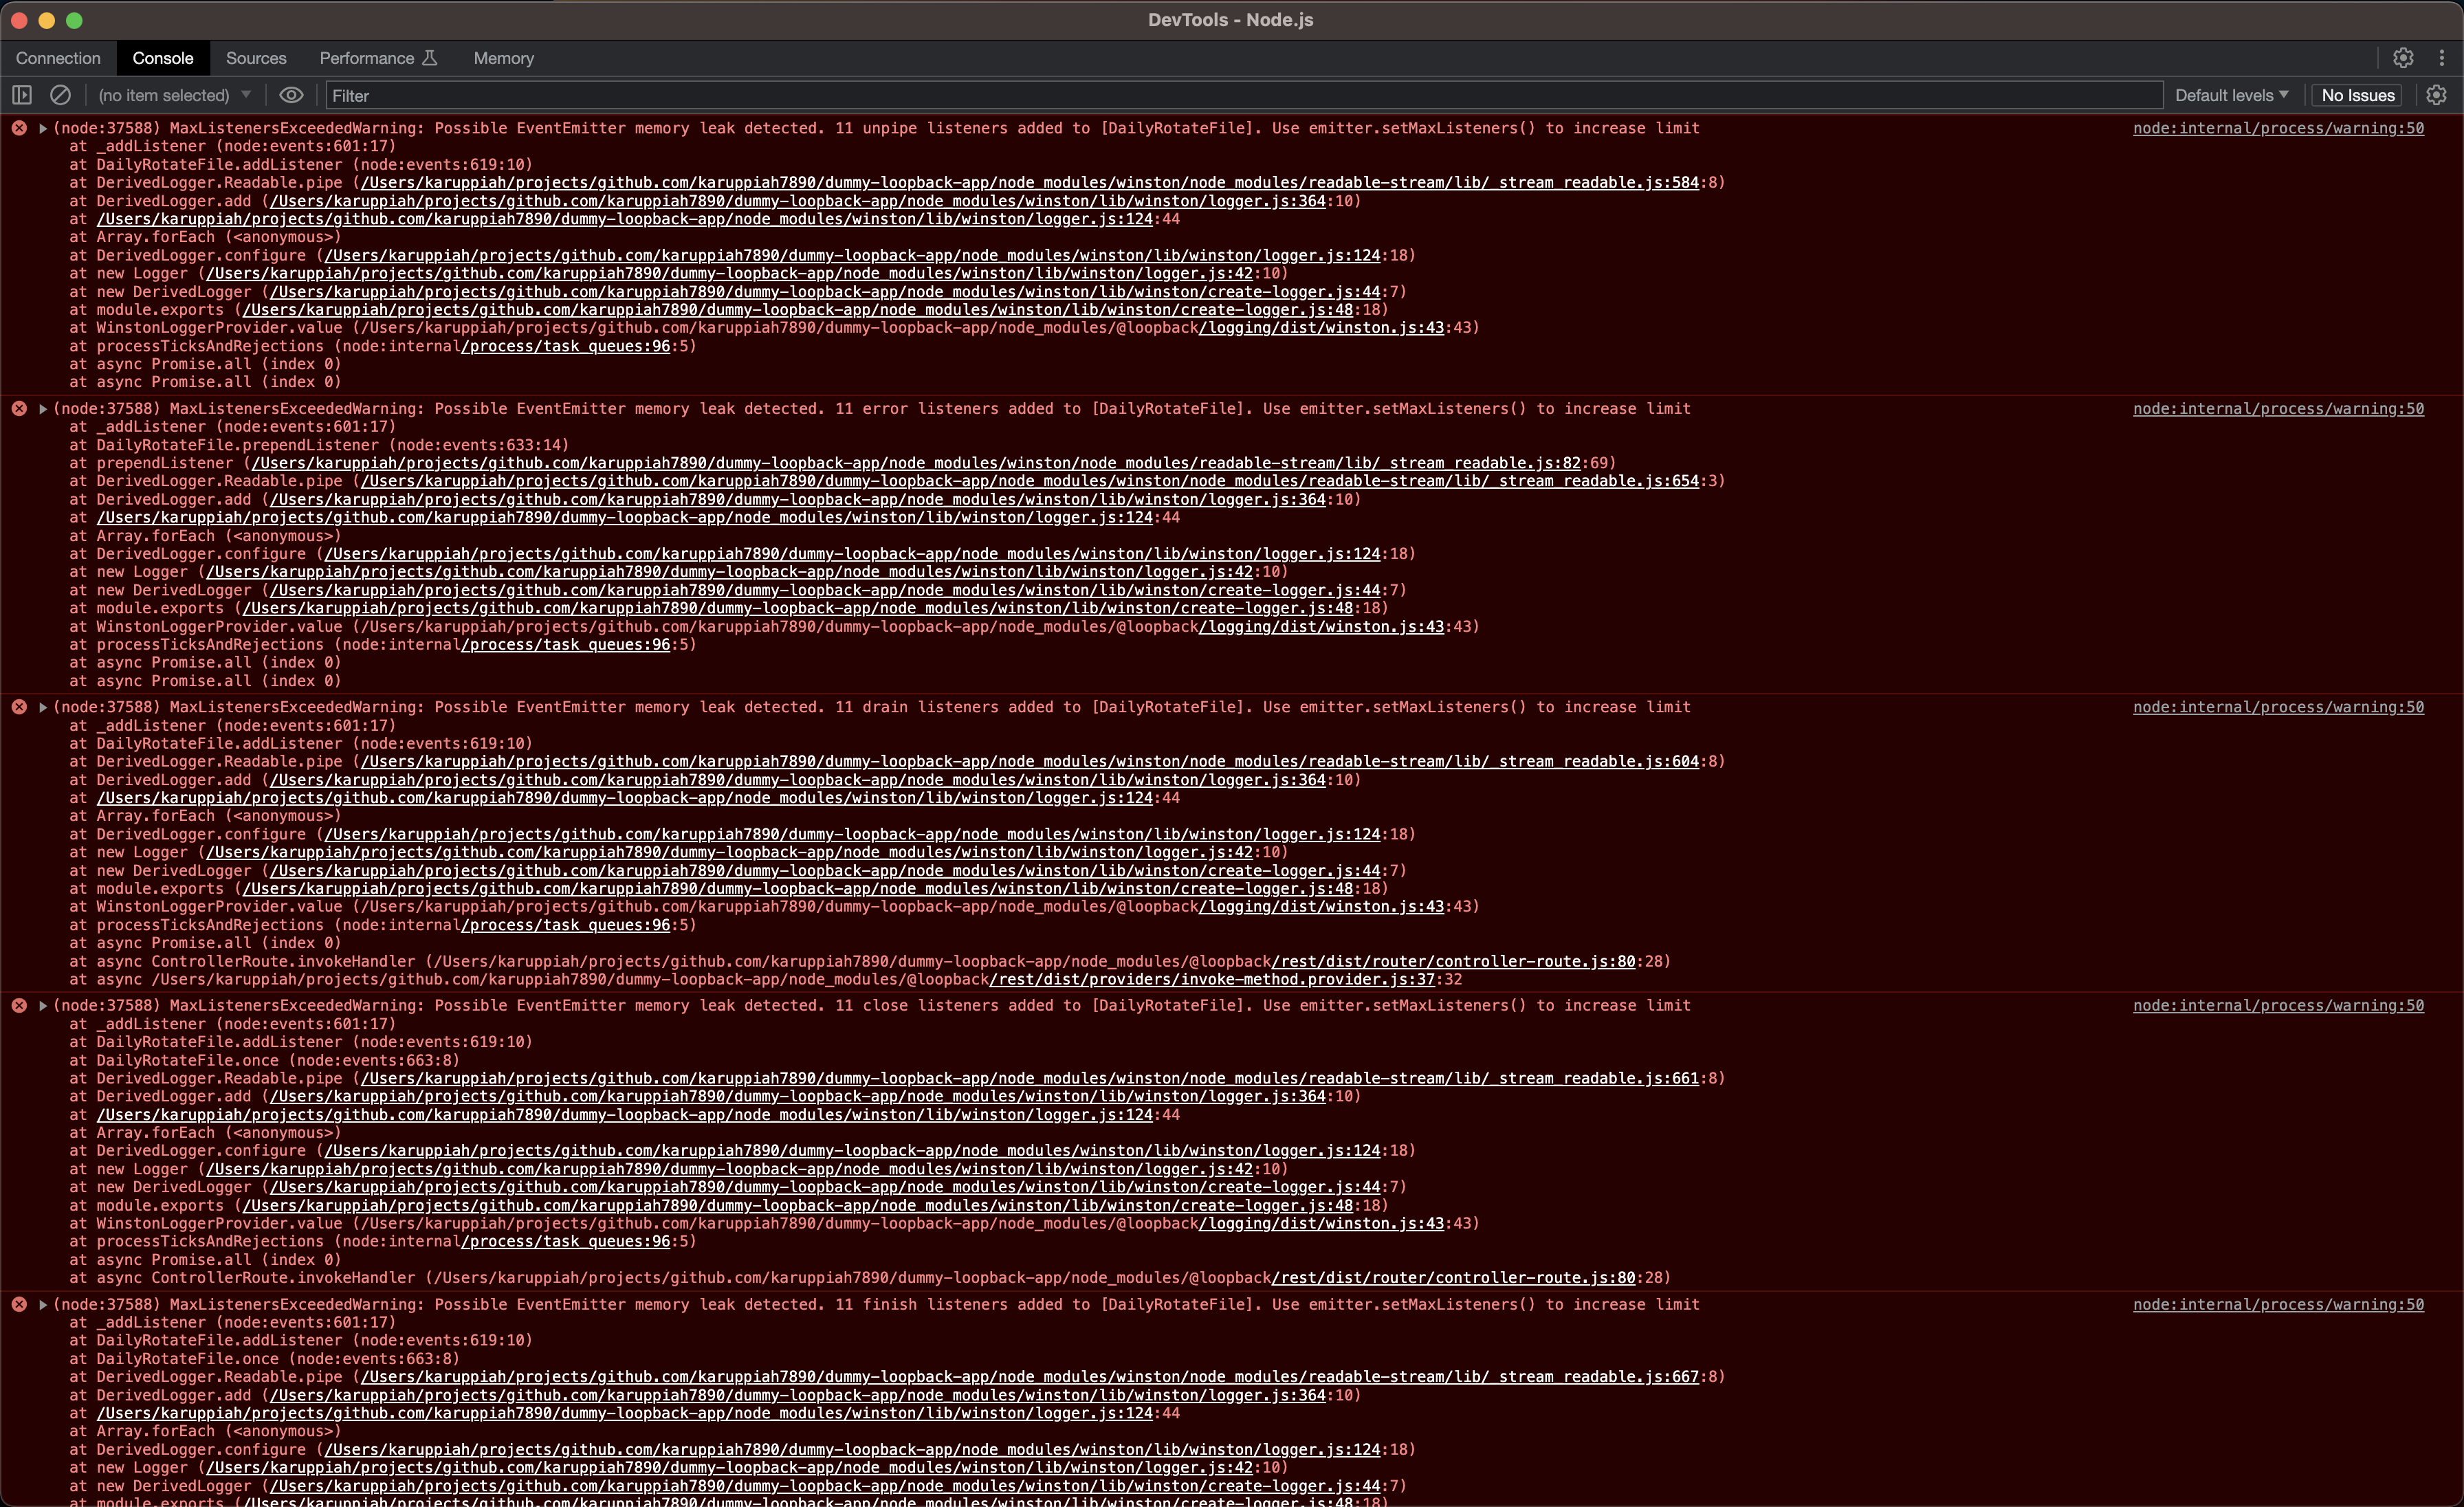
We can also notice many warnings ❗️ ⚠️ ❕ in the Chrome DevTools console
With the fix in fixed branch, let's look at how the doctor tool output will look like -
cd dummy-loopback-app

git checkout fixed

npm run rebuild

NODE_ENV=production clinic doctor \
  --autocannon [ --headers accept=application/json \
  --headers content-type=application/json \
  --method GET http://localhost:3000/ping  \
  --connections 100 \
  --duration 100 ] -- node --trace-warnings dist/index.js
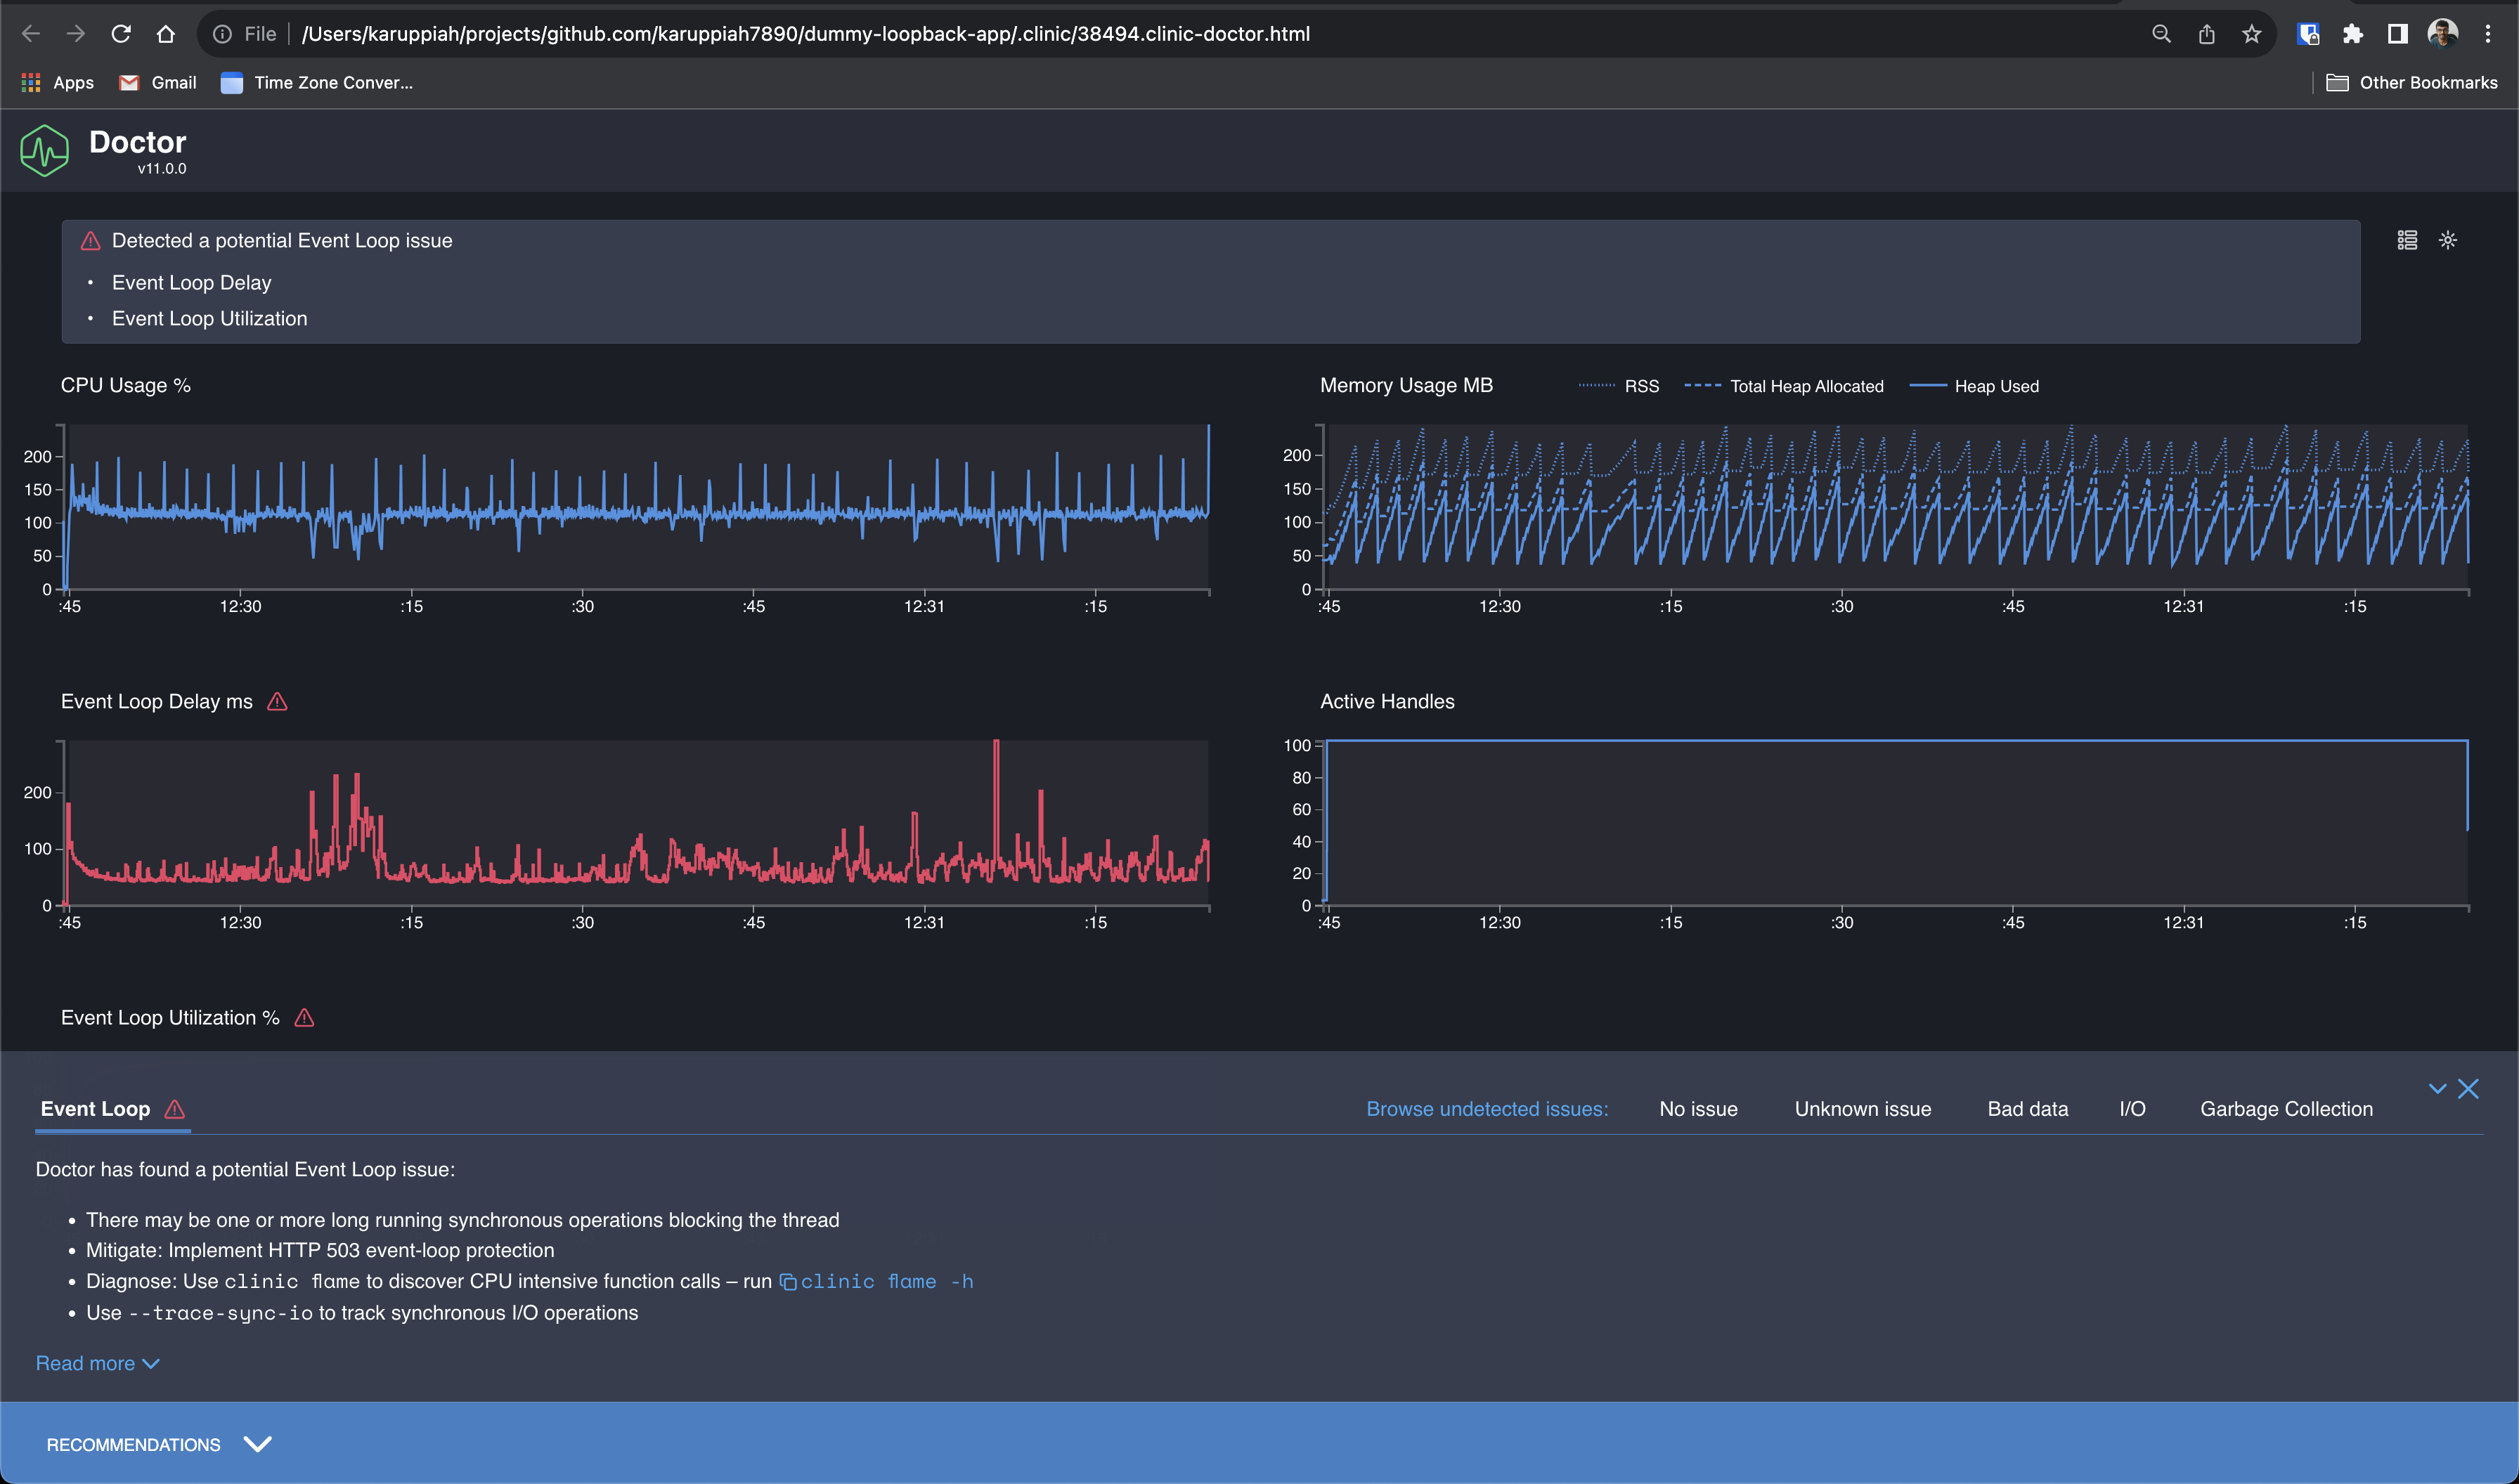
This is how the doctor tool output will look like -

We can see a different problem now - something about a potential event loop issue. In memory, there's no high memory usage, but we can still see some sine wave/cosine wave in the memory usage graph. Something to checkout
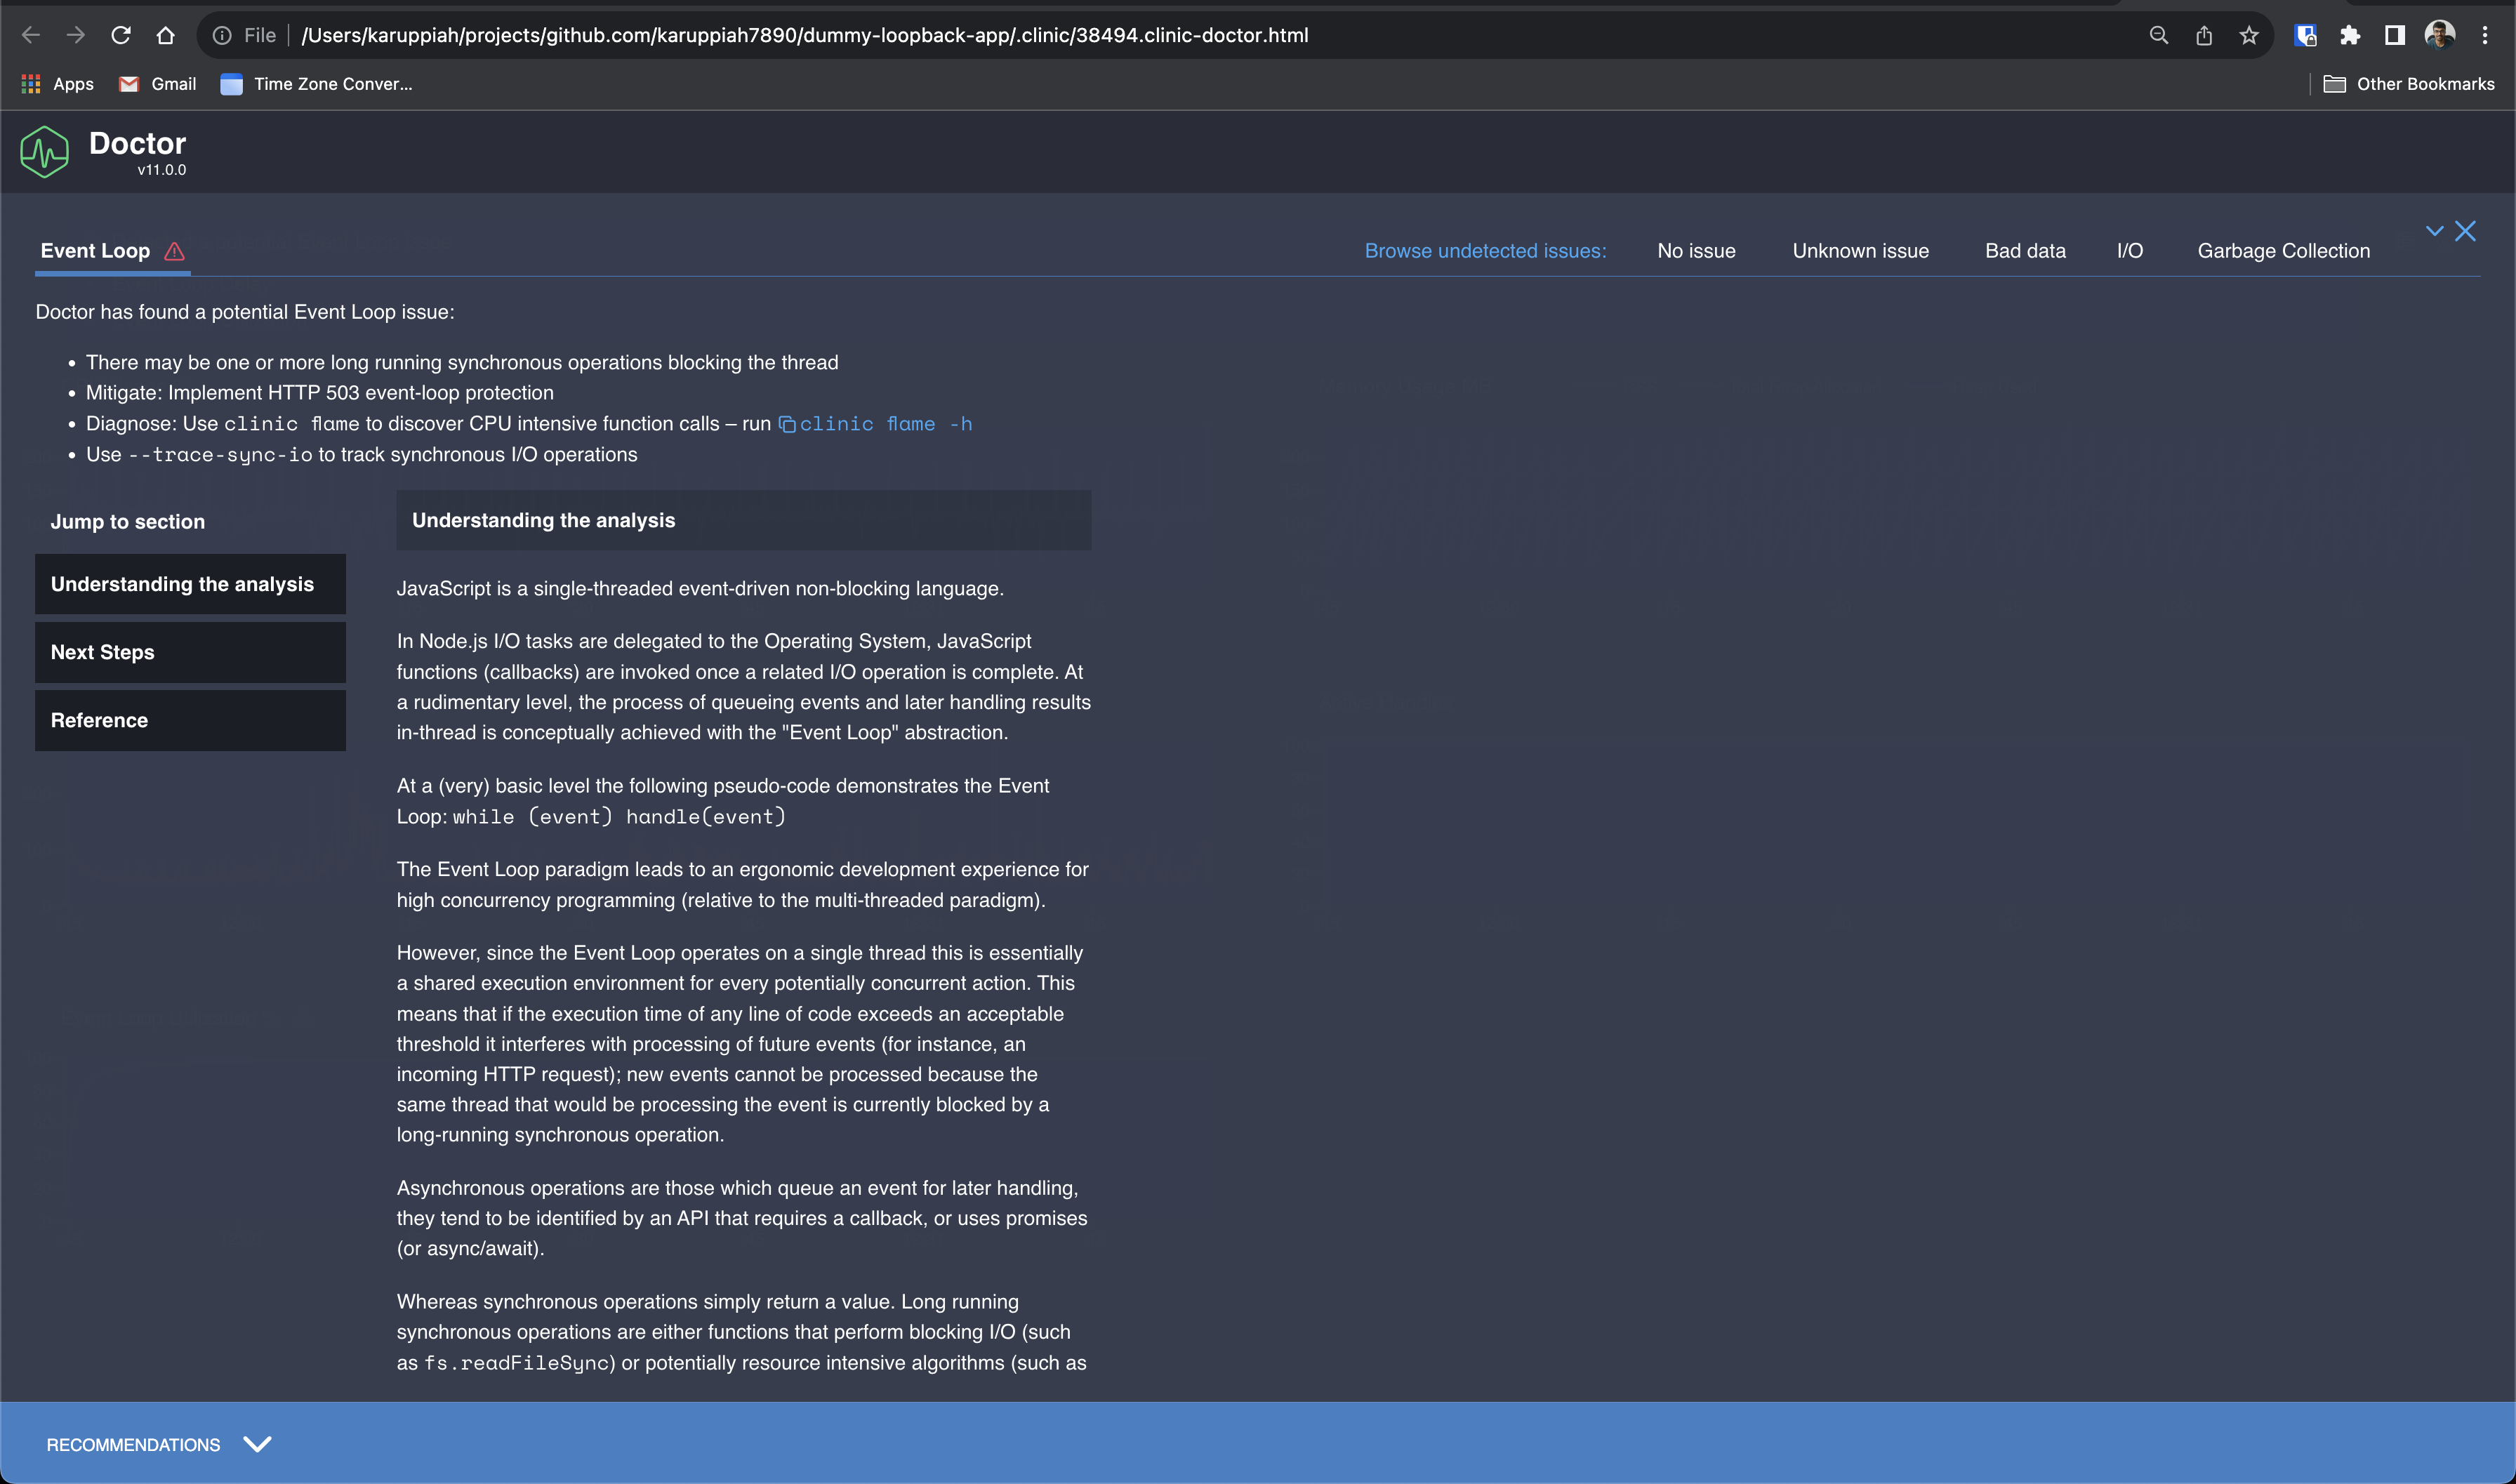
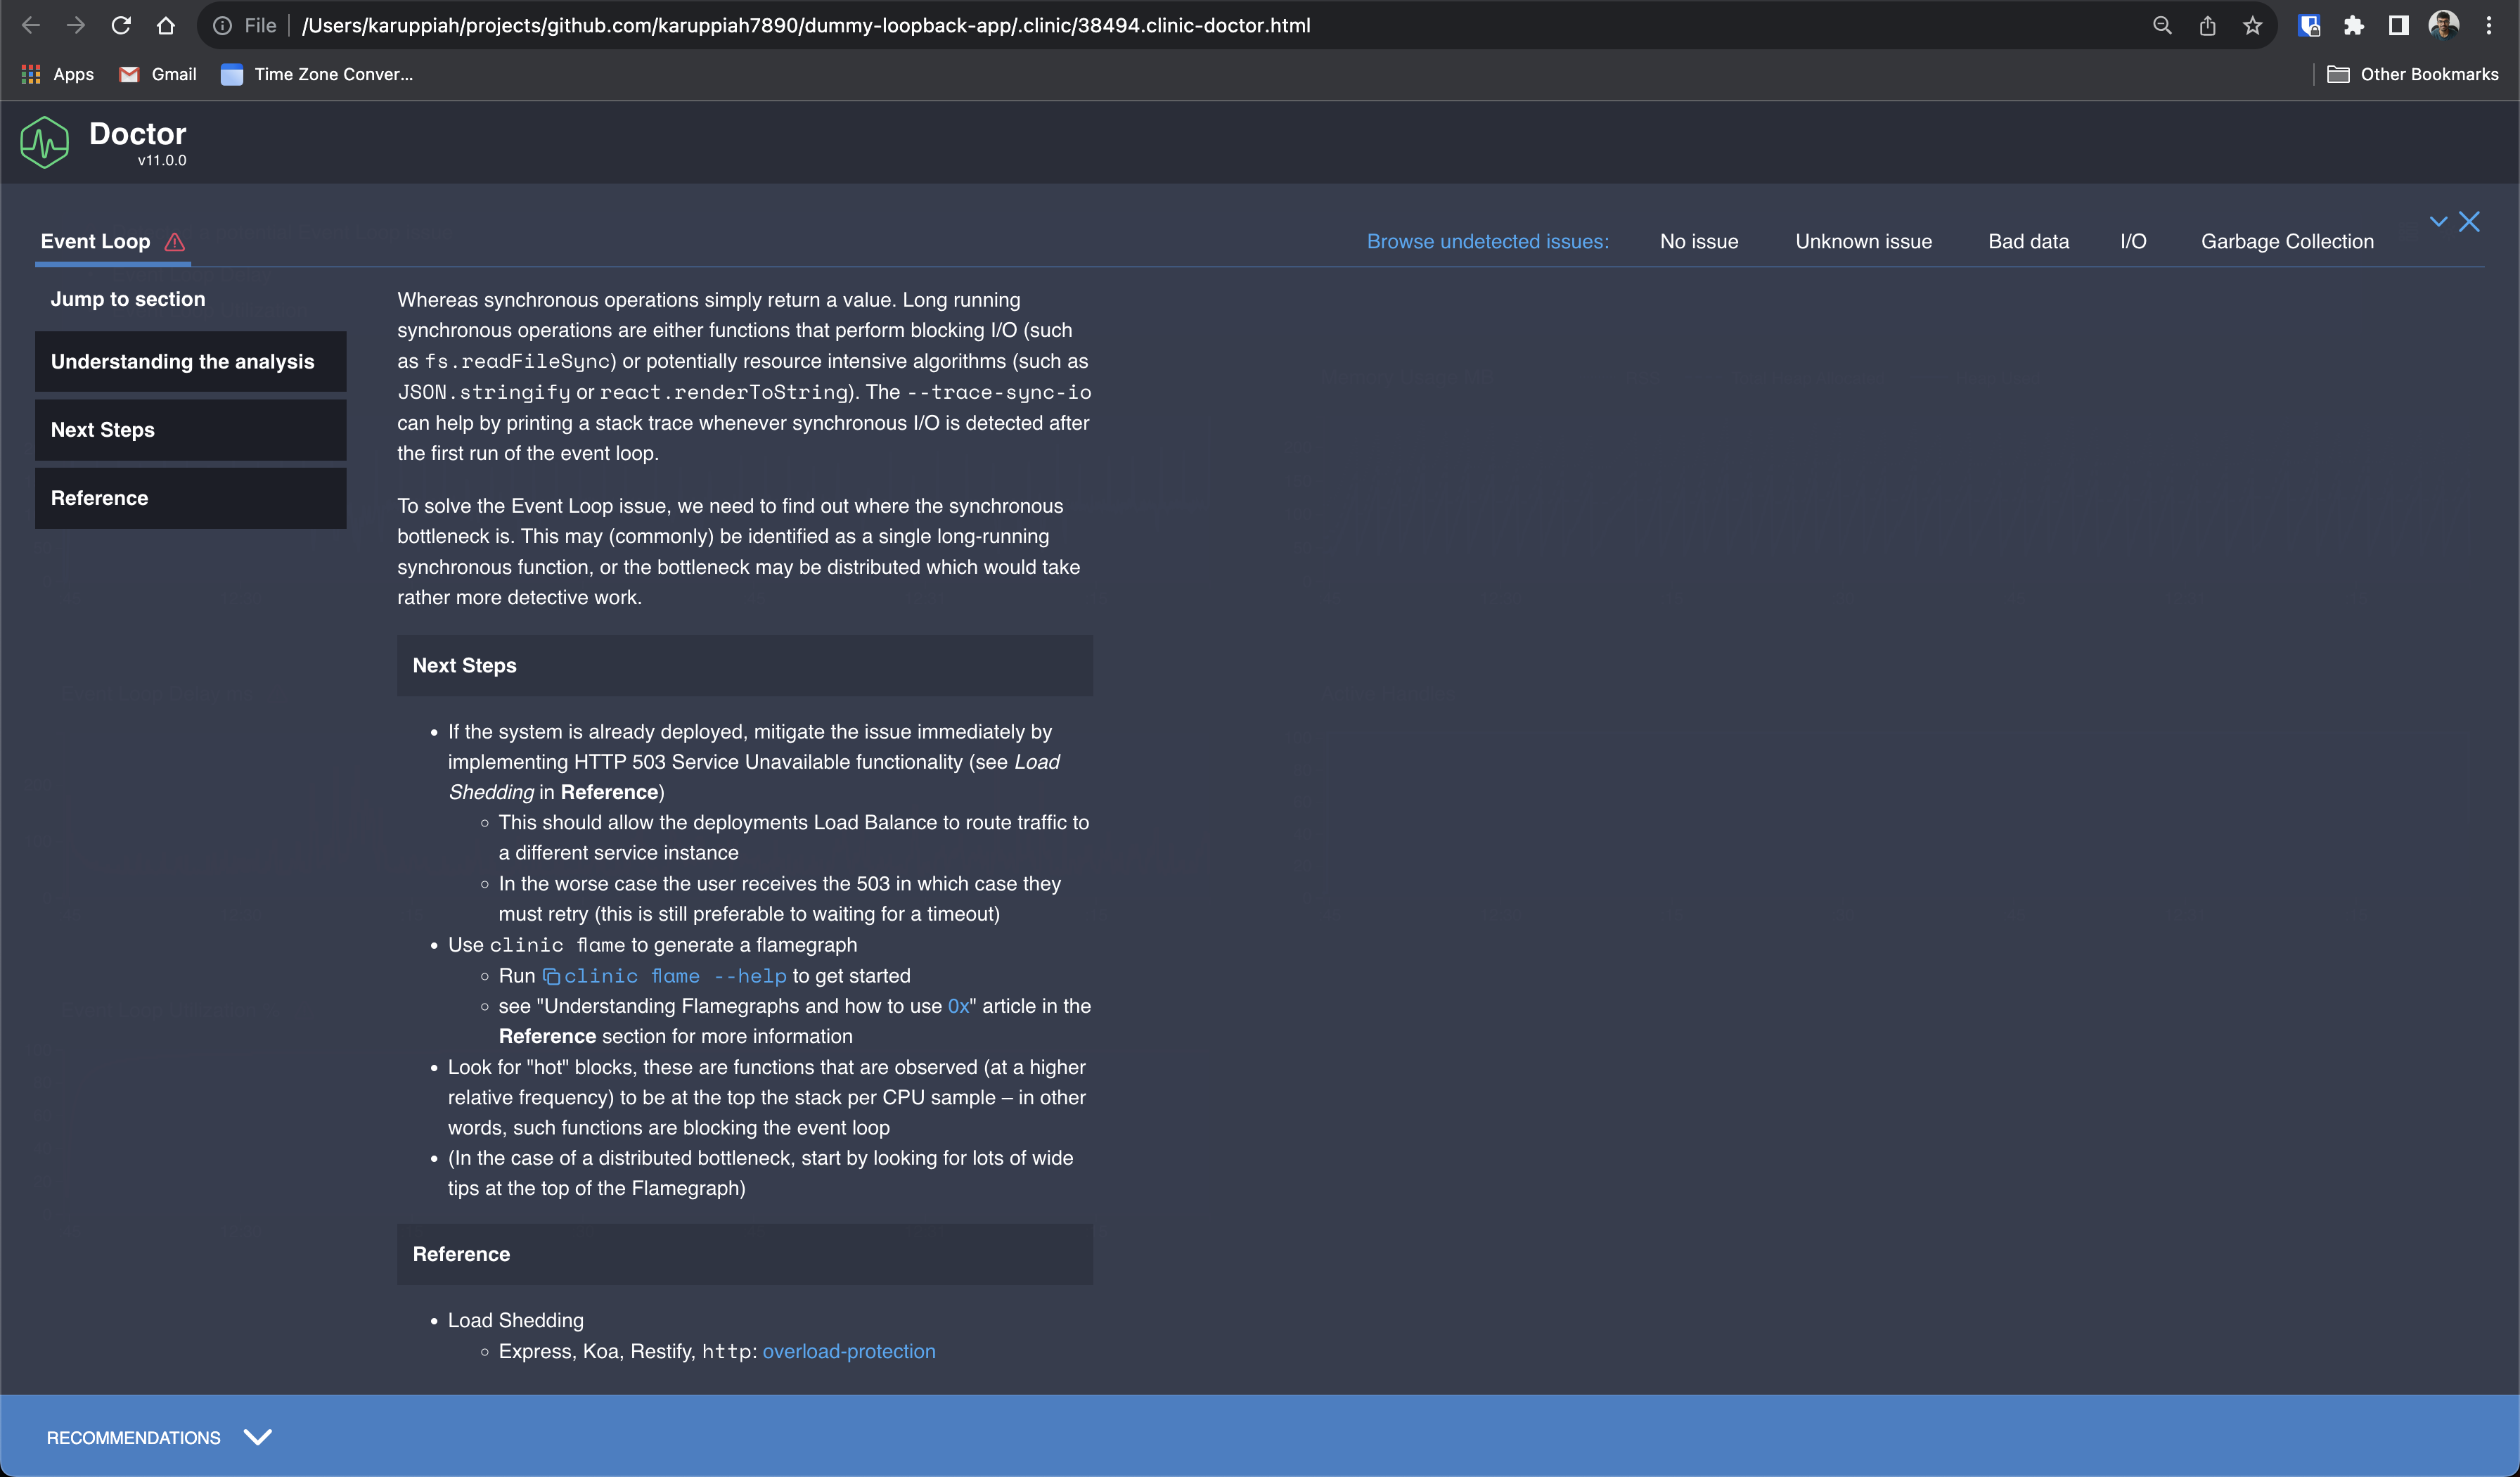
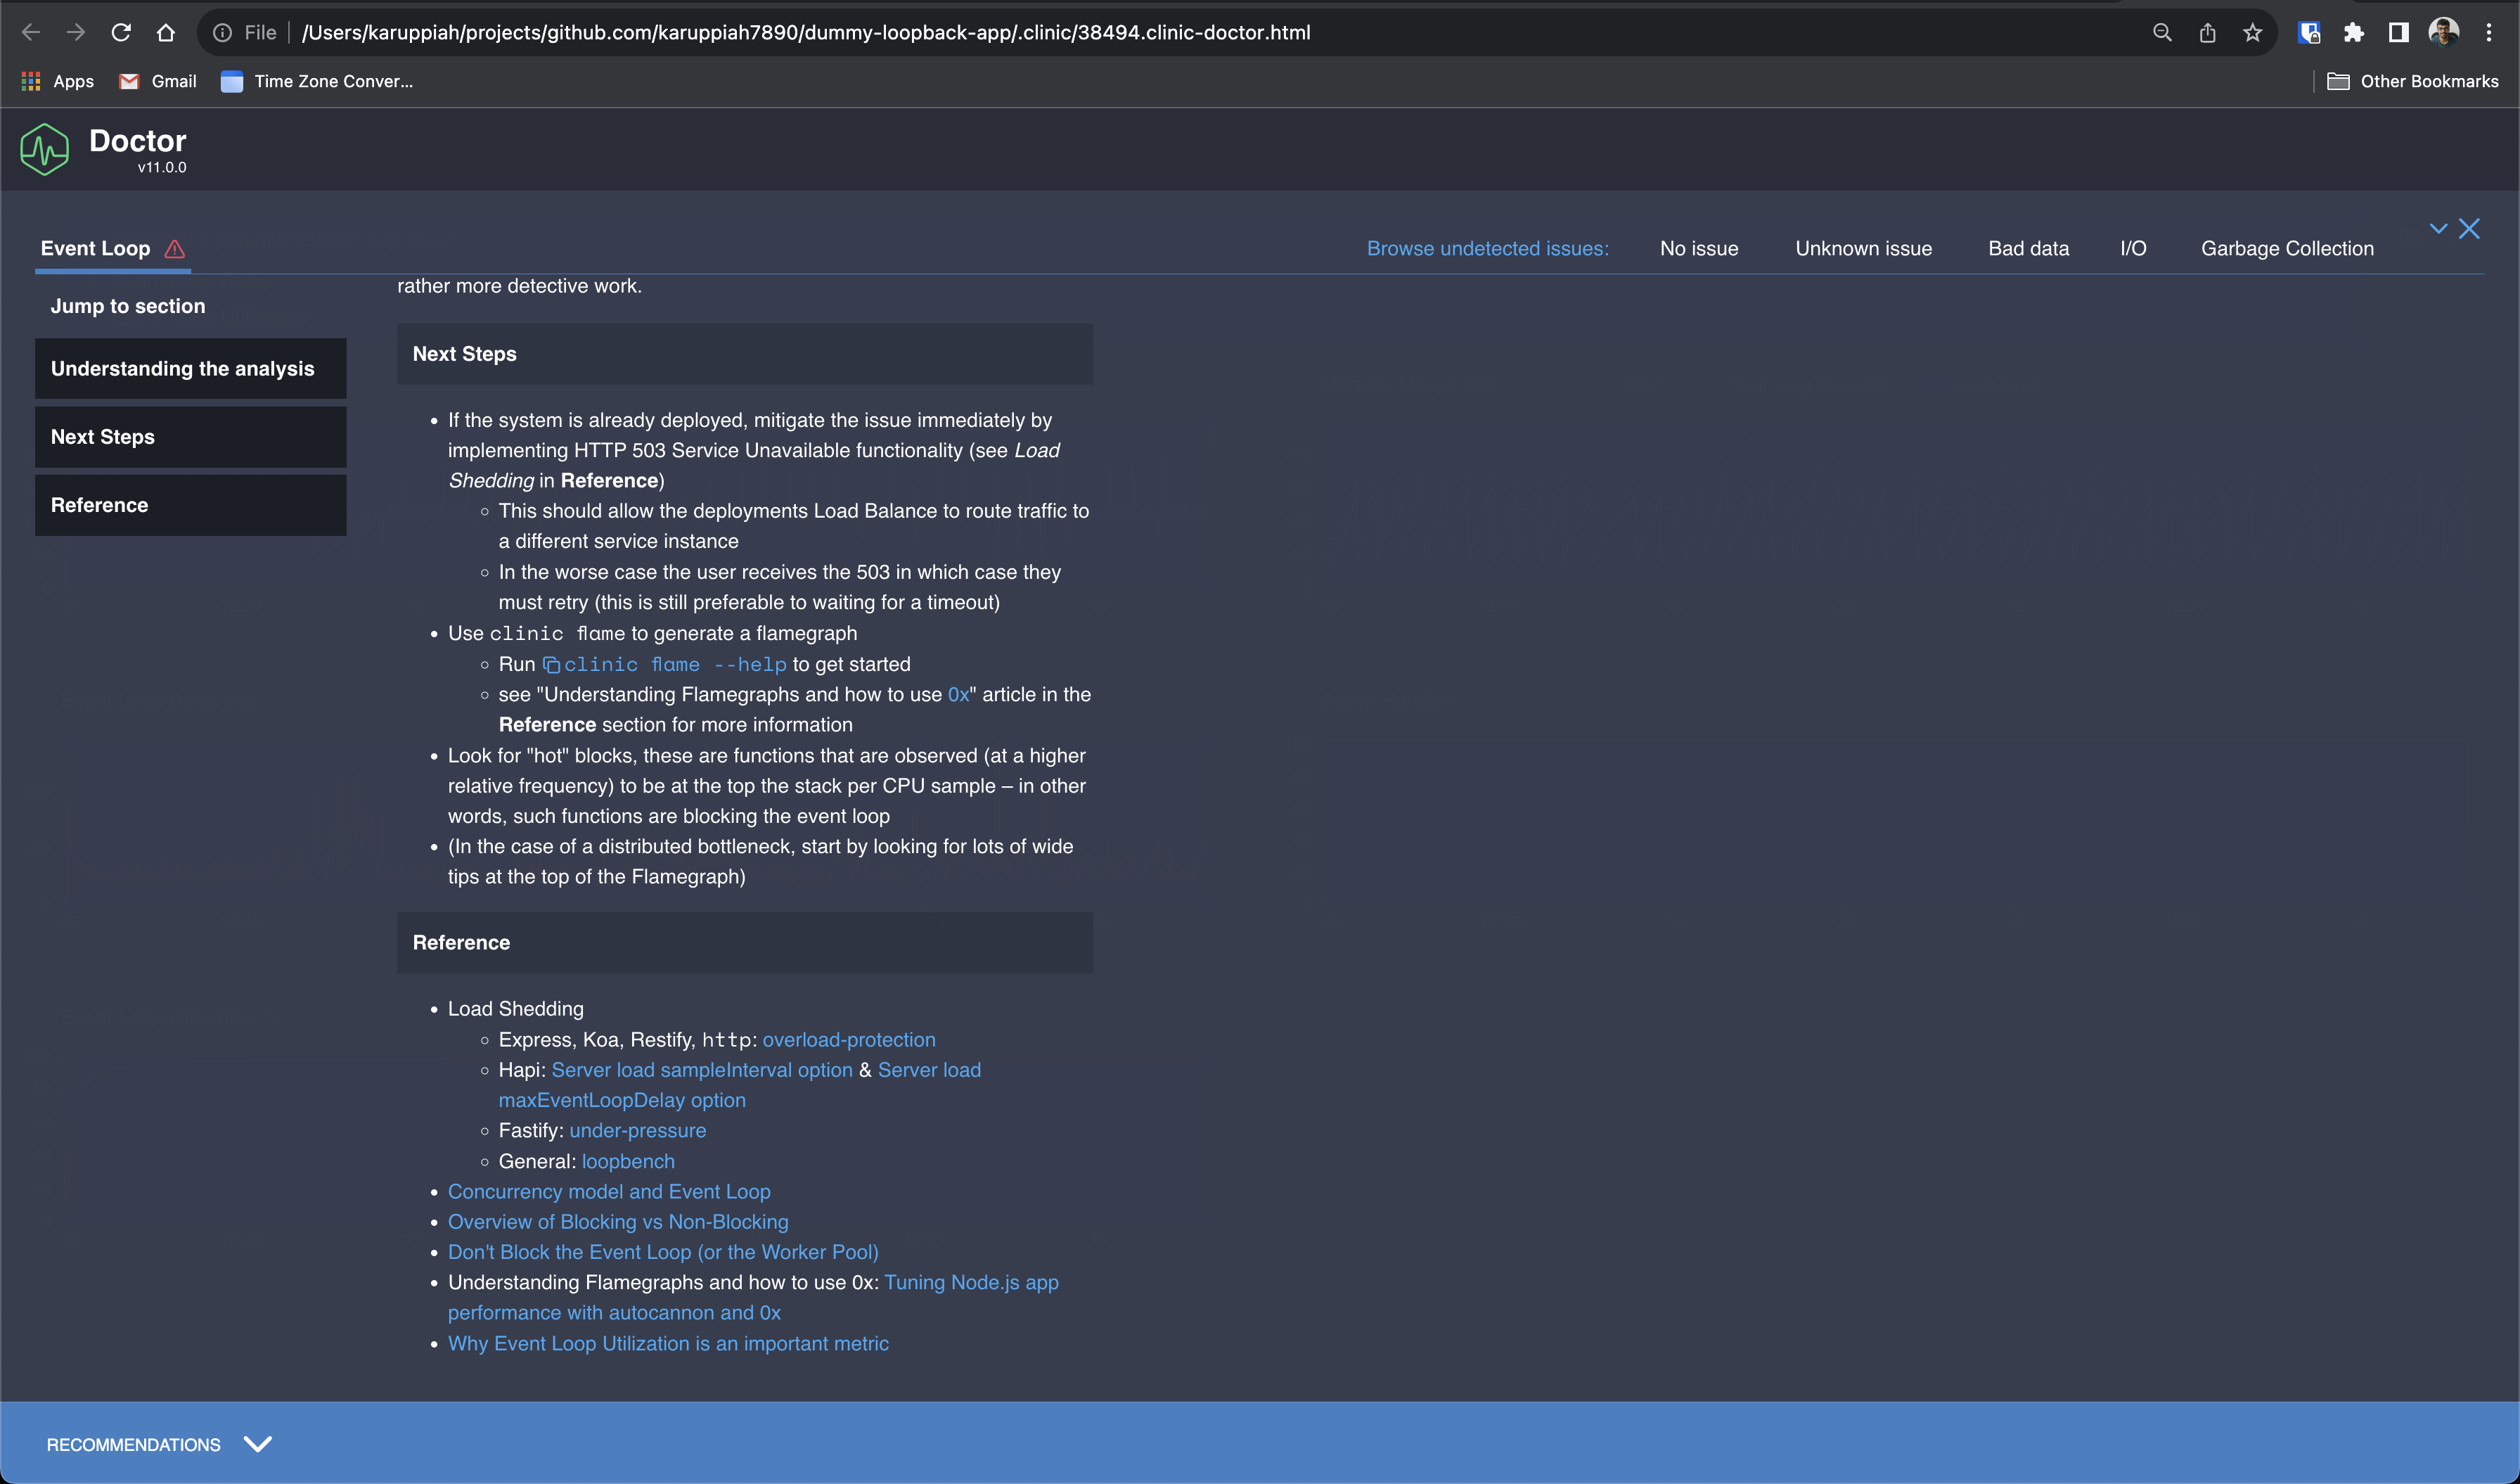
I'll probably checkout this issue separately and talk about it in a new blog post :)
Below is the commit message I wrote for the fix in the ingestion service to capture the context of the change I made
do logging in a separate service and make event ingestion service to create a singleton instance

reason:
Previously I think a new logger was created
for every instance of event ingestion
controller. And I also think event ingestion
controller gets created for every request.
And since event ingestion service was a class
with BindingScope.TRANSIENT scope, I think it
was also created for every controller. So,
concluding on this what I think at a high
level is - a lot of event ingestion controllers
were created (this is okay and expected I think)
- one for every request, and for each controller
there's a new logger created and injected and for
each controller a new ingestion service is created
and for each ingestion service a logger was injected
but not sure if it was a brand new logger everytime or
not. So, to reduce the number of loggers to be created,
we have compartmentalized and put a wrapper around the
winston logger for loopback. This wrapper is implemented
as a logging service in loopback and it's only a singleton - so
only one instance of it and in it we inject one logger.
We then use the logging service in event ingestion
controller and event ingestion service by injecting it
using loopback dependency injection feature

this gets rid of all the "memory leak" warnings we get when we
run tests, or when we run the service and hit it with high traffic
This kind of big and clear commit message captures the why behind the code since the code has the "what". I kind of made a similar commit message for the dummy service - https://github.com/karuppiah7890/dummy-loopback-app/commit/1626c89d2ded878a837186ab47561e9020ab7a6e
You can find the rough notes/gist I used to write this article here - https://gist.github.com/karuppiah7890/0c7db67c83116ebc457397ee98a7117c
All the other Slack alerts we got till the fix was put in -
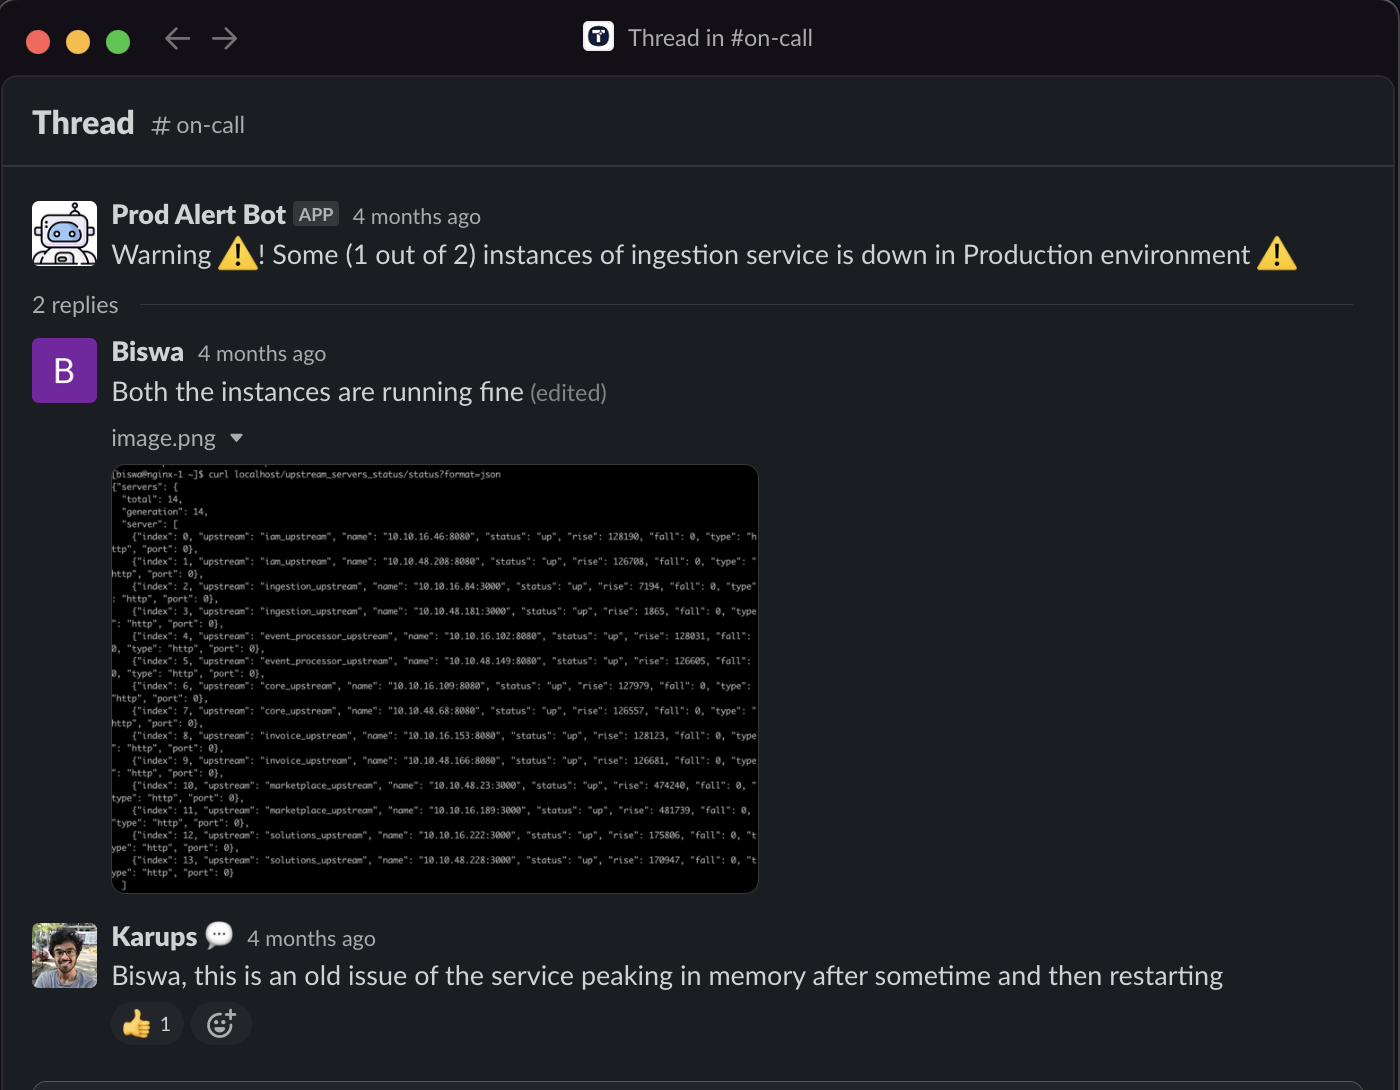
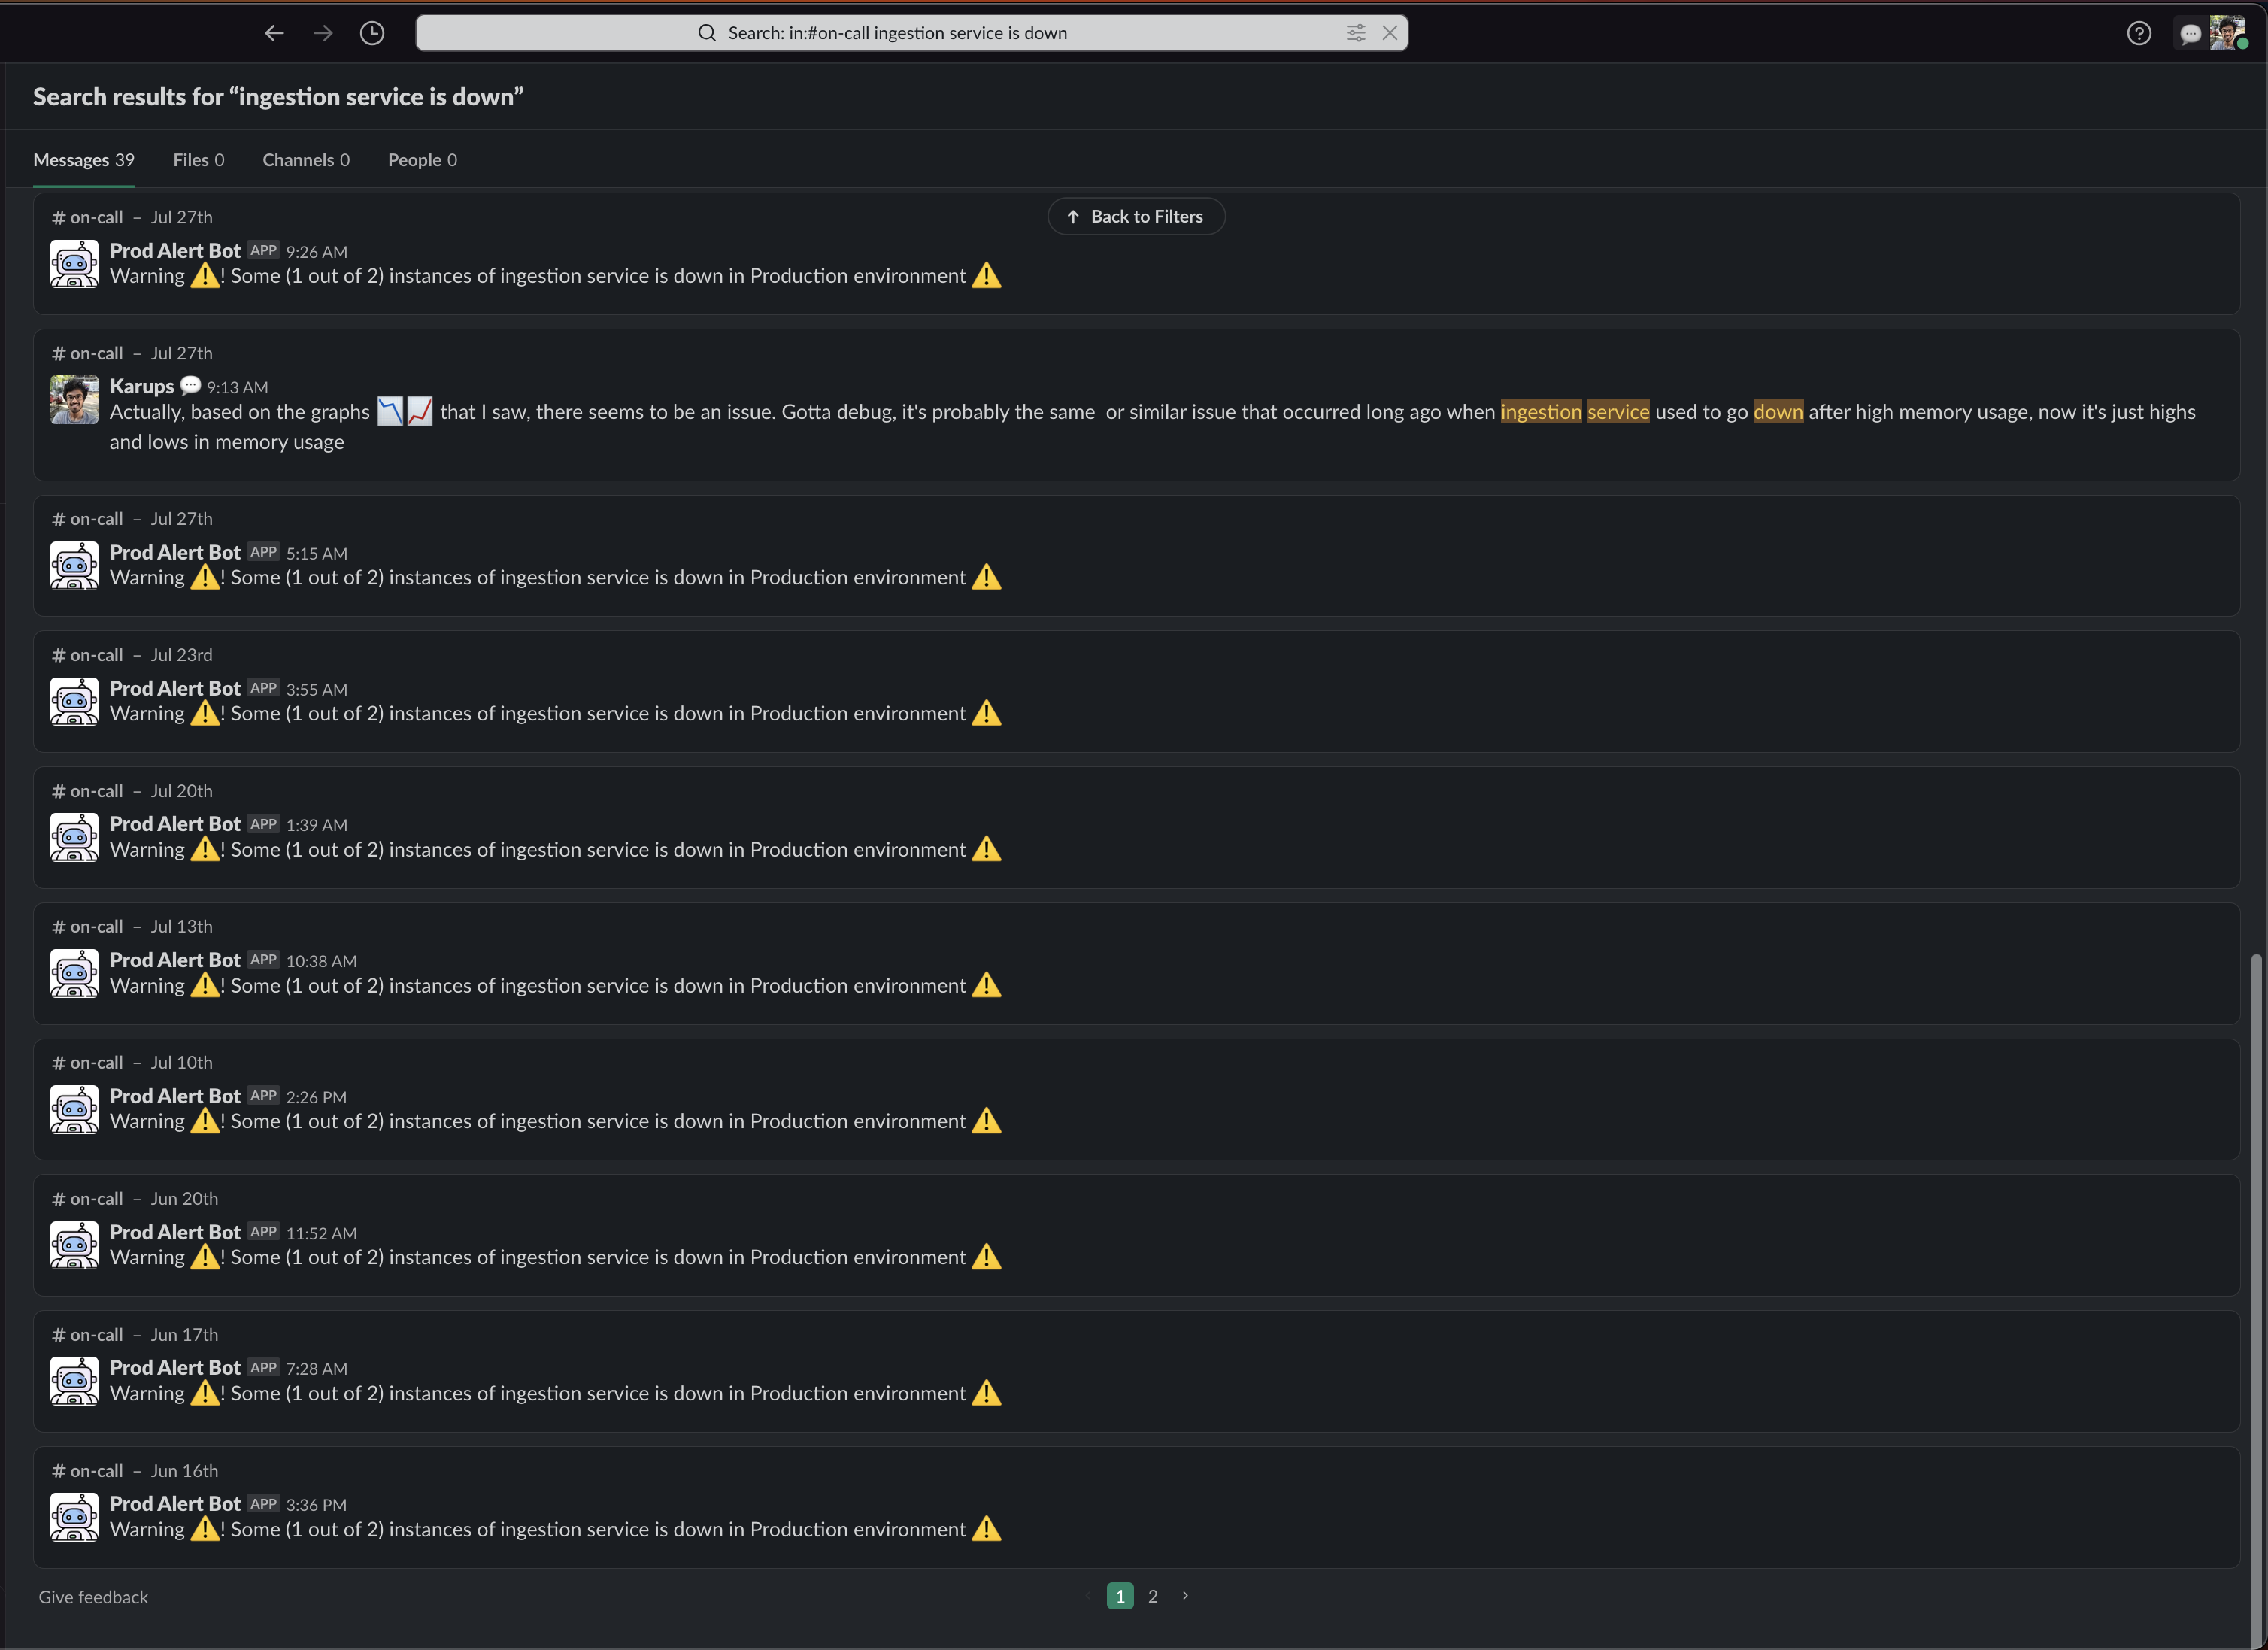
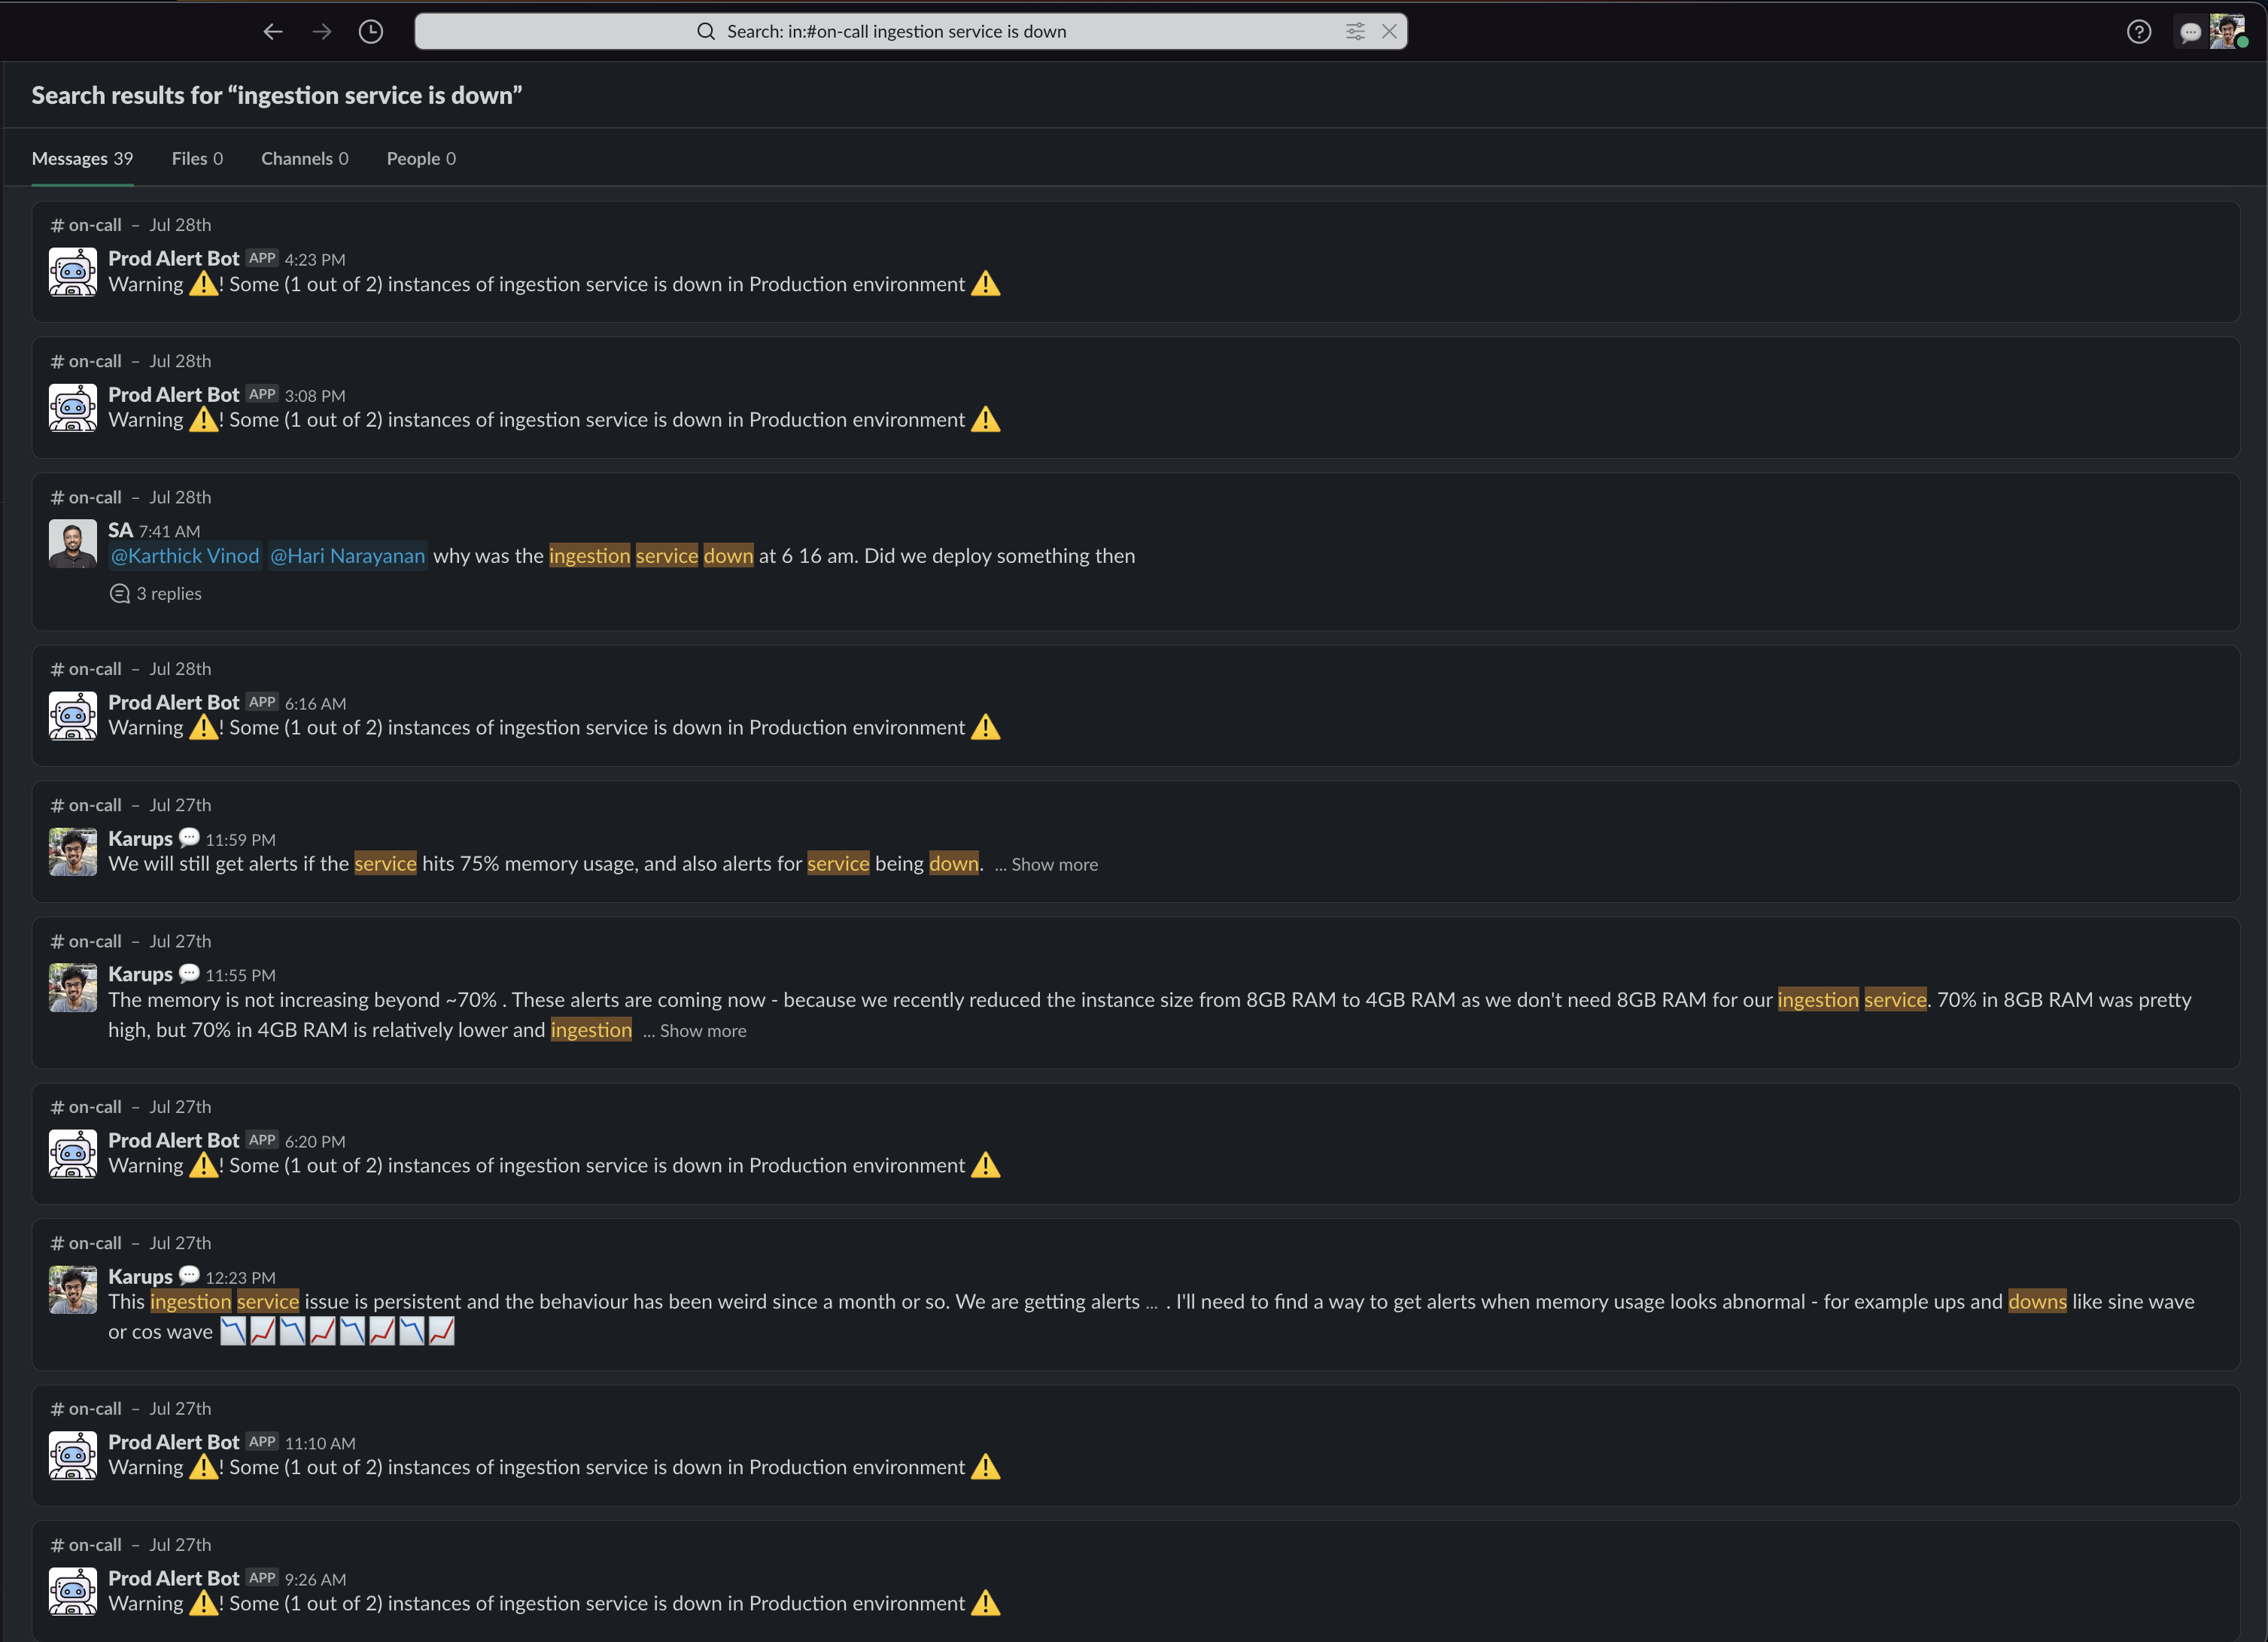

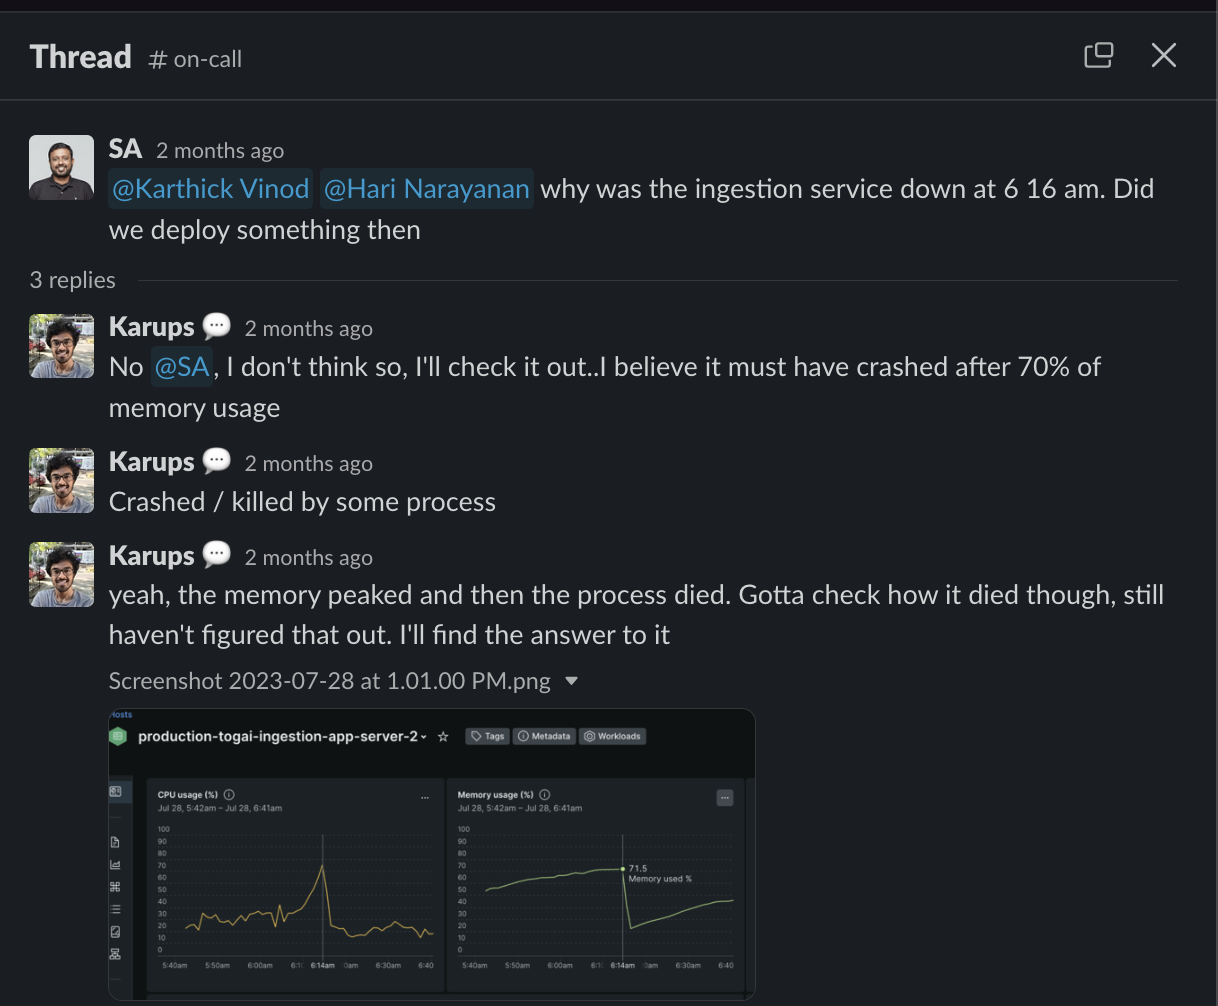
Finally, after July 30th, 2023, we never got those Slack alerts again 🚨 🔔 ‼️ :)
The graphs looked like this later -
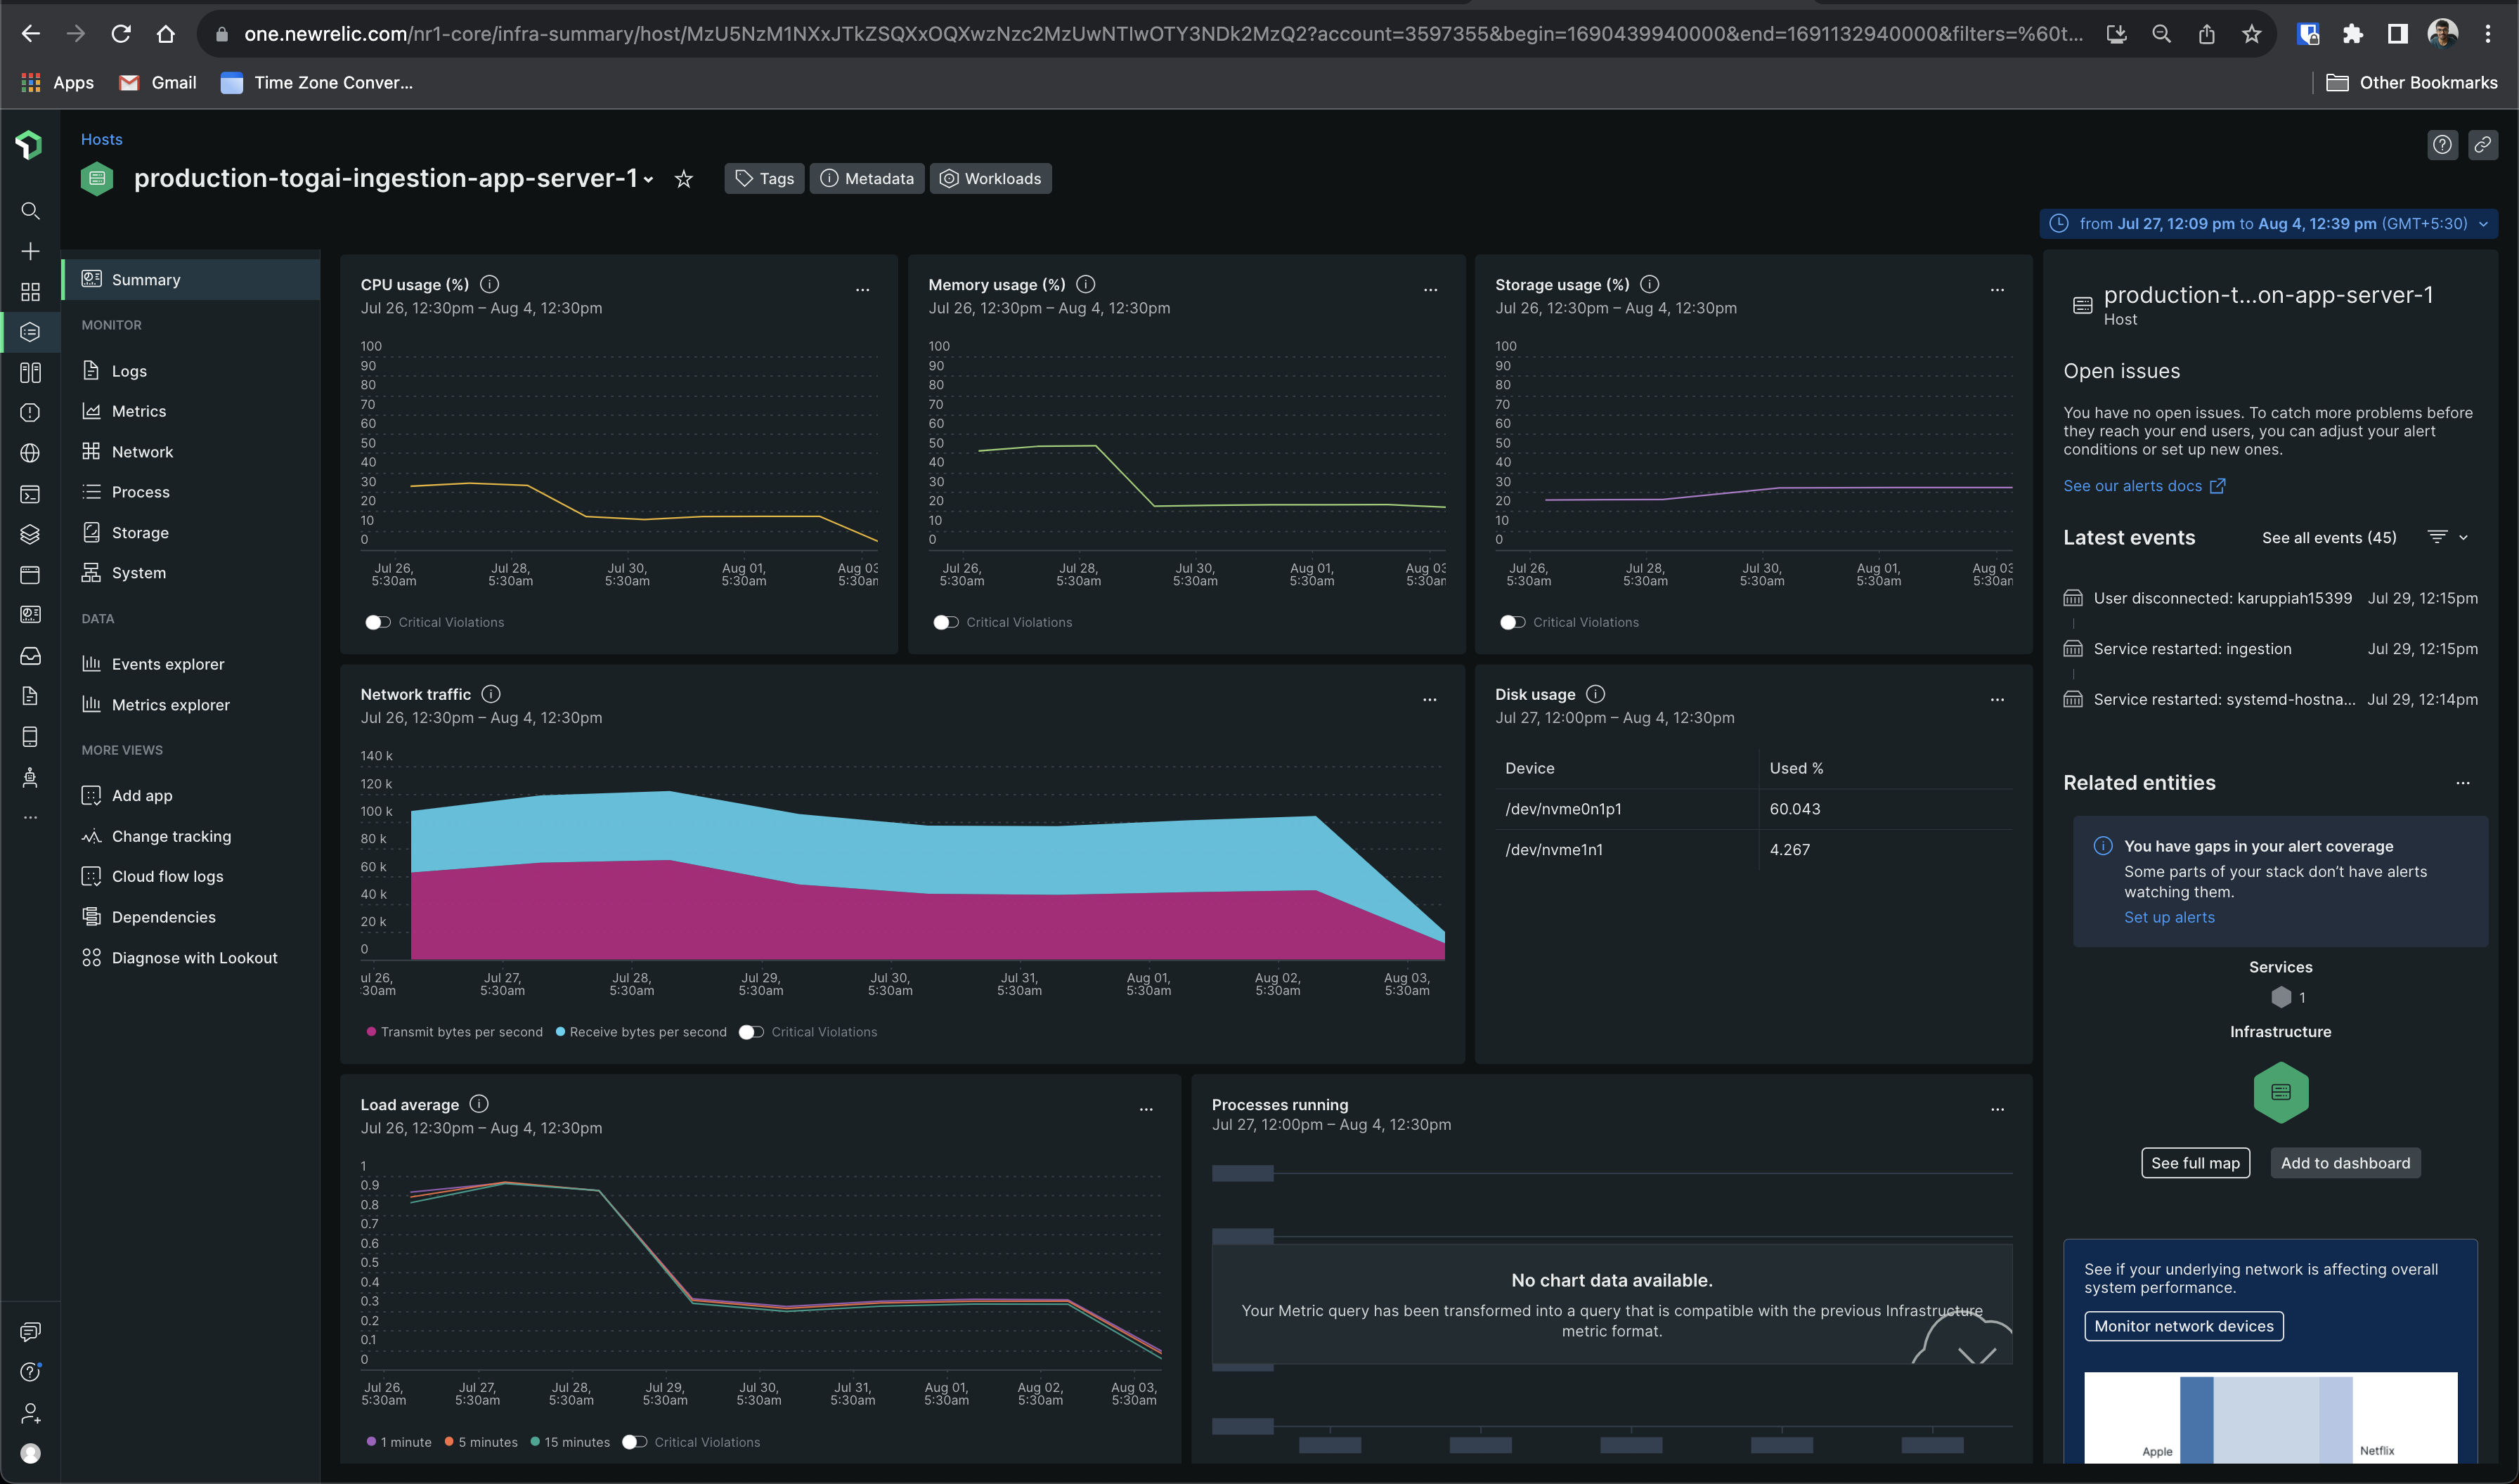
Notice the dip in memory usage. The Application Performance Monitoring (APM) graph looked like this -
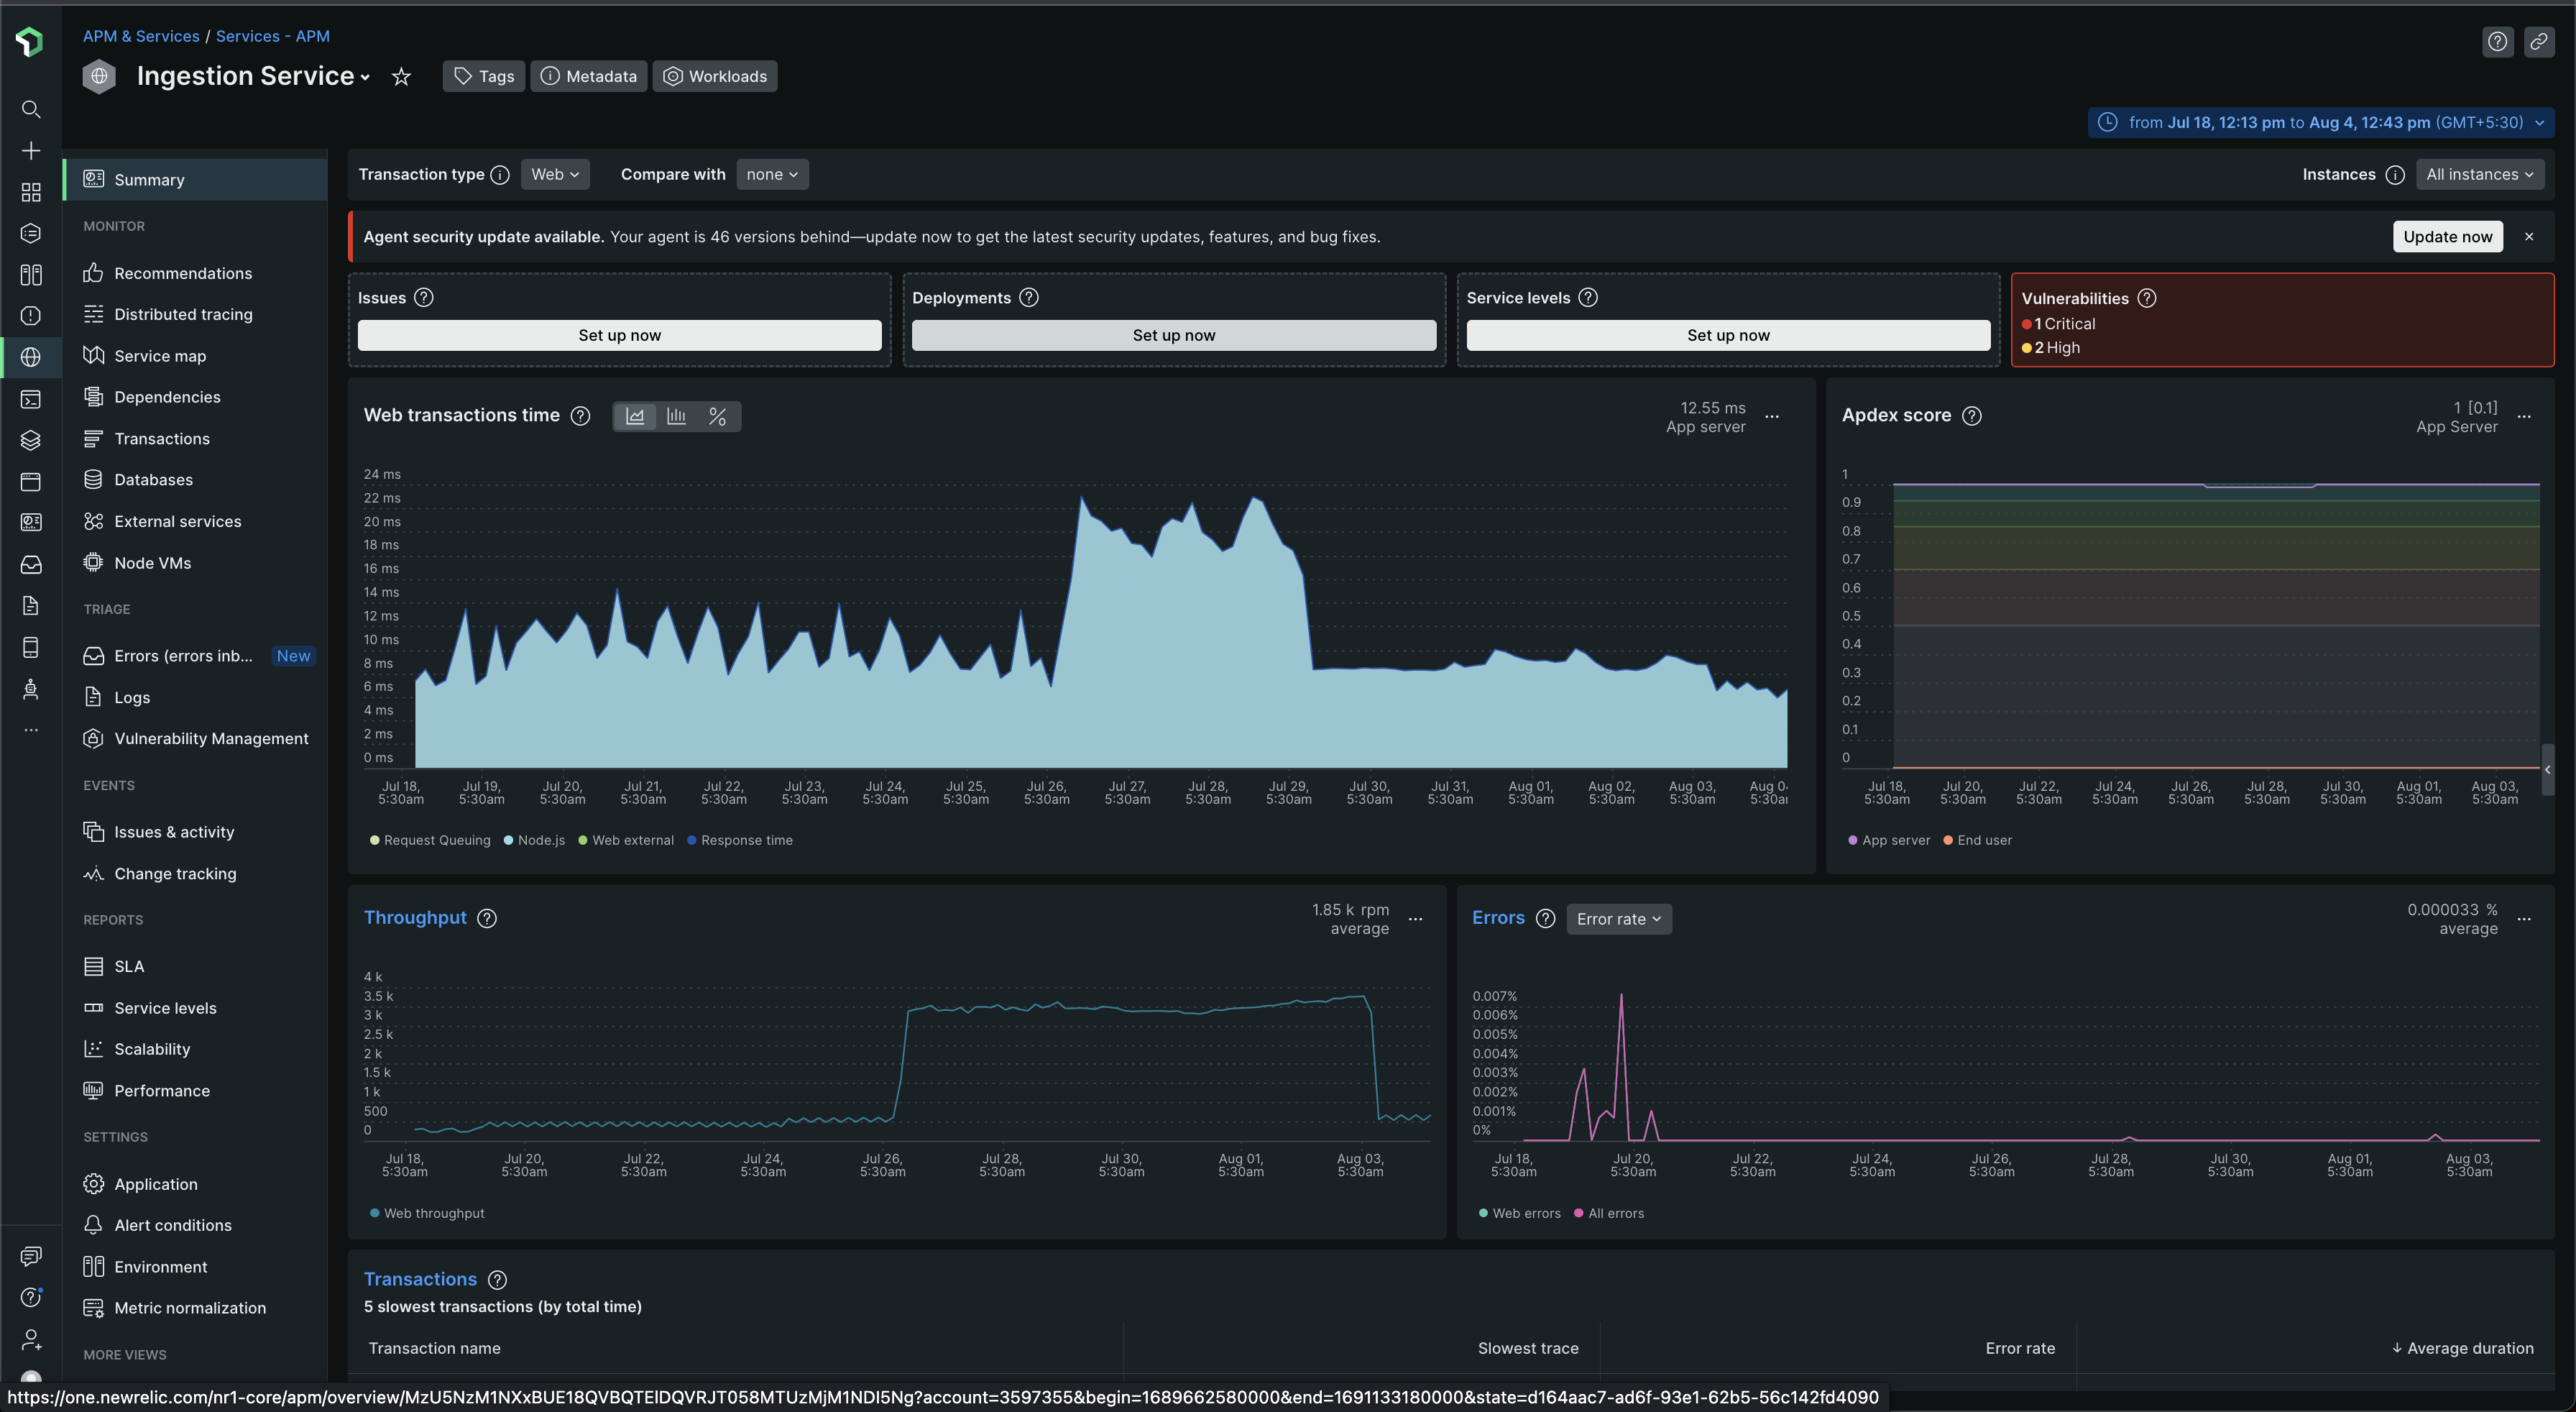
Notice how response times were high and erratic before July 30th 2023
The latest graphs look like this 😁
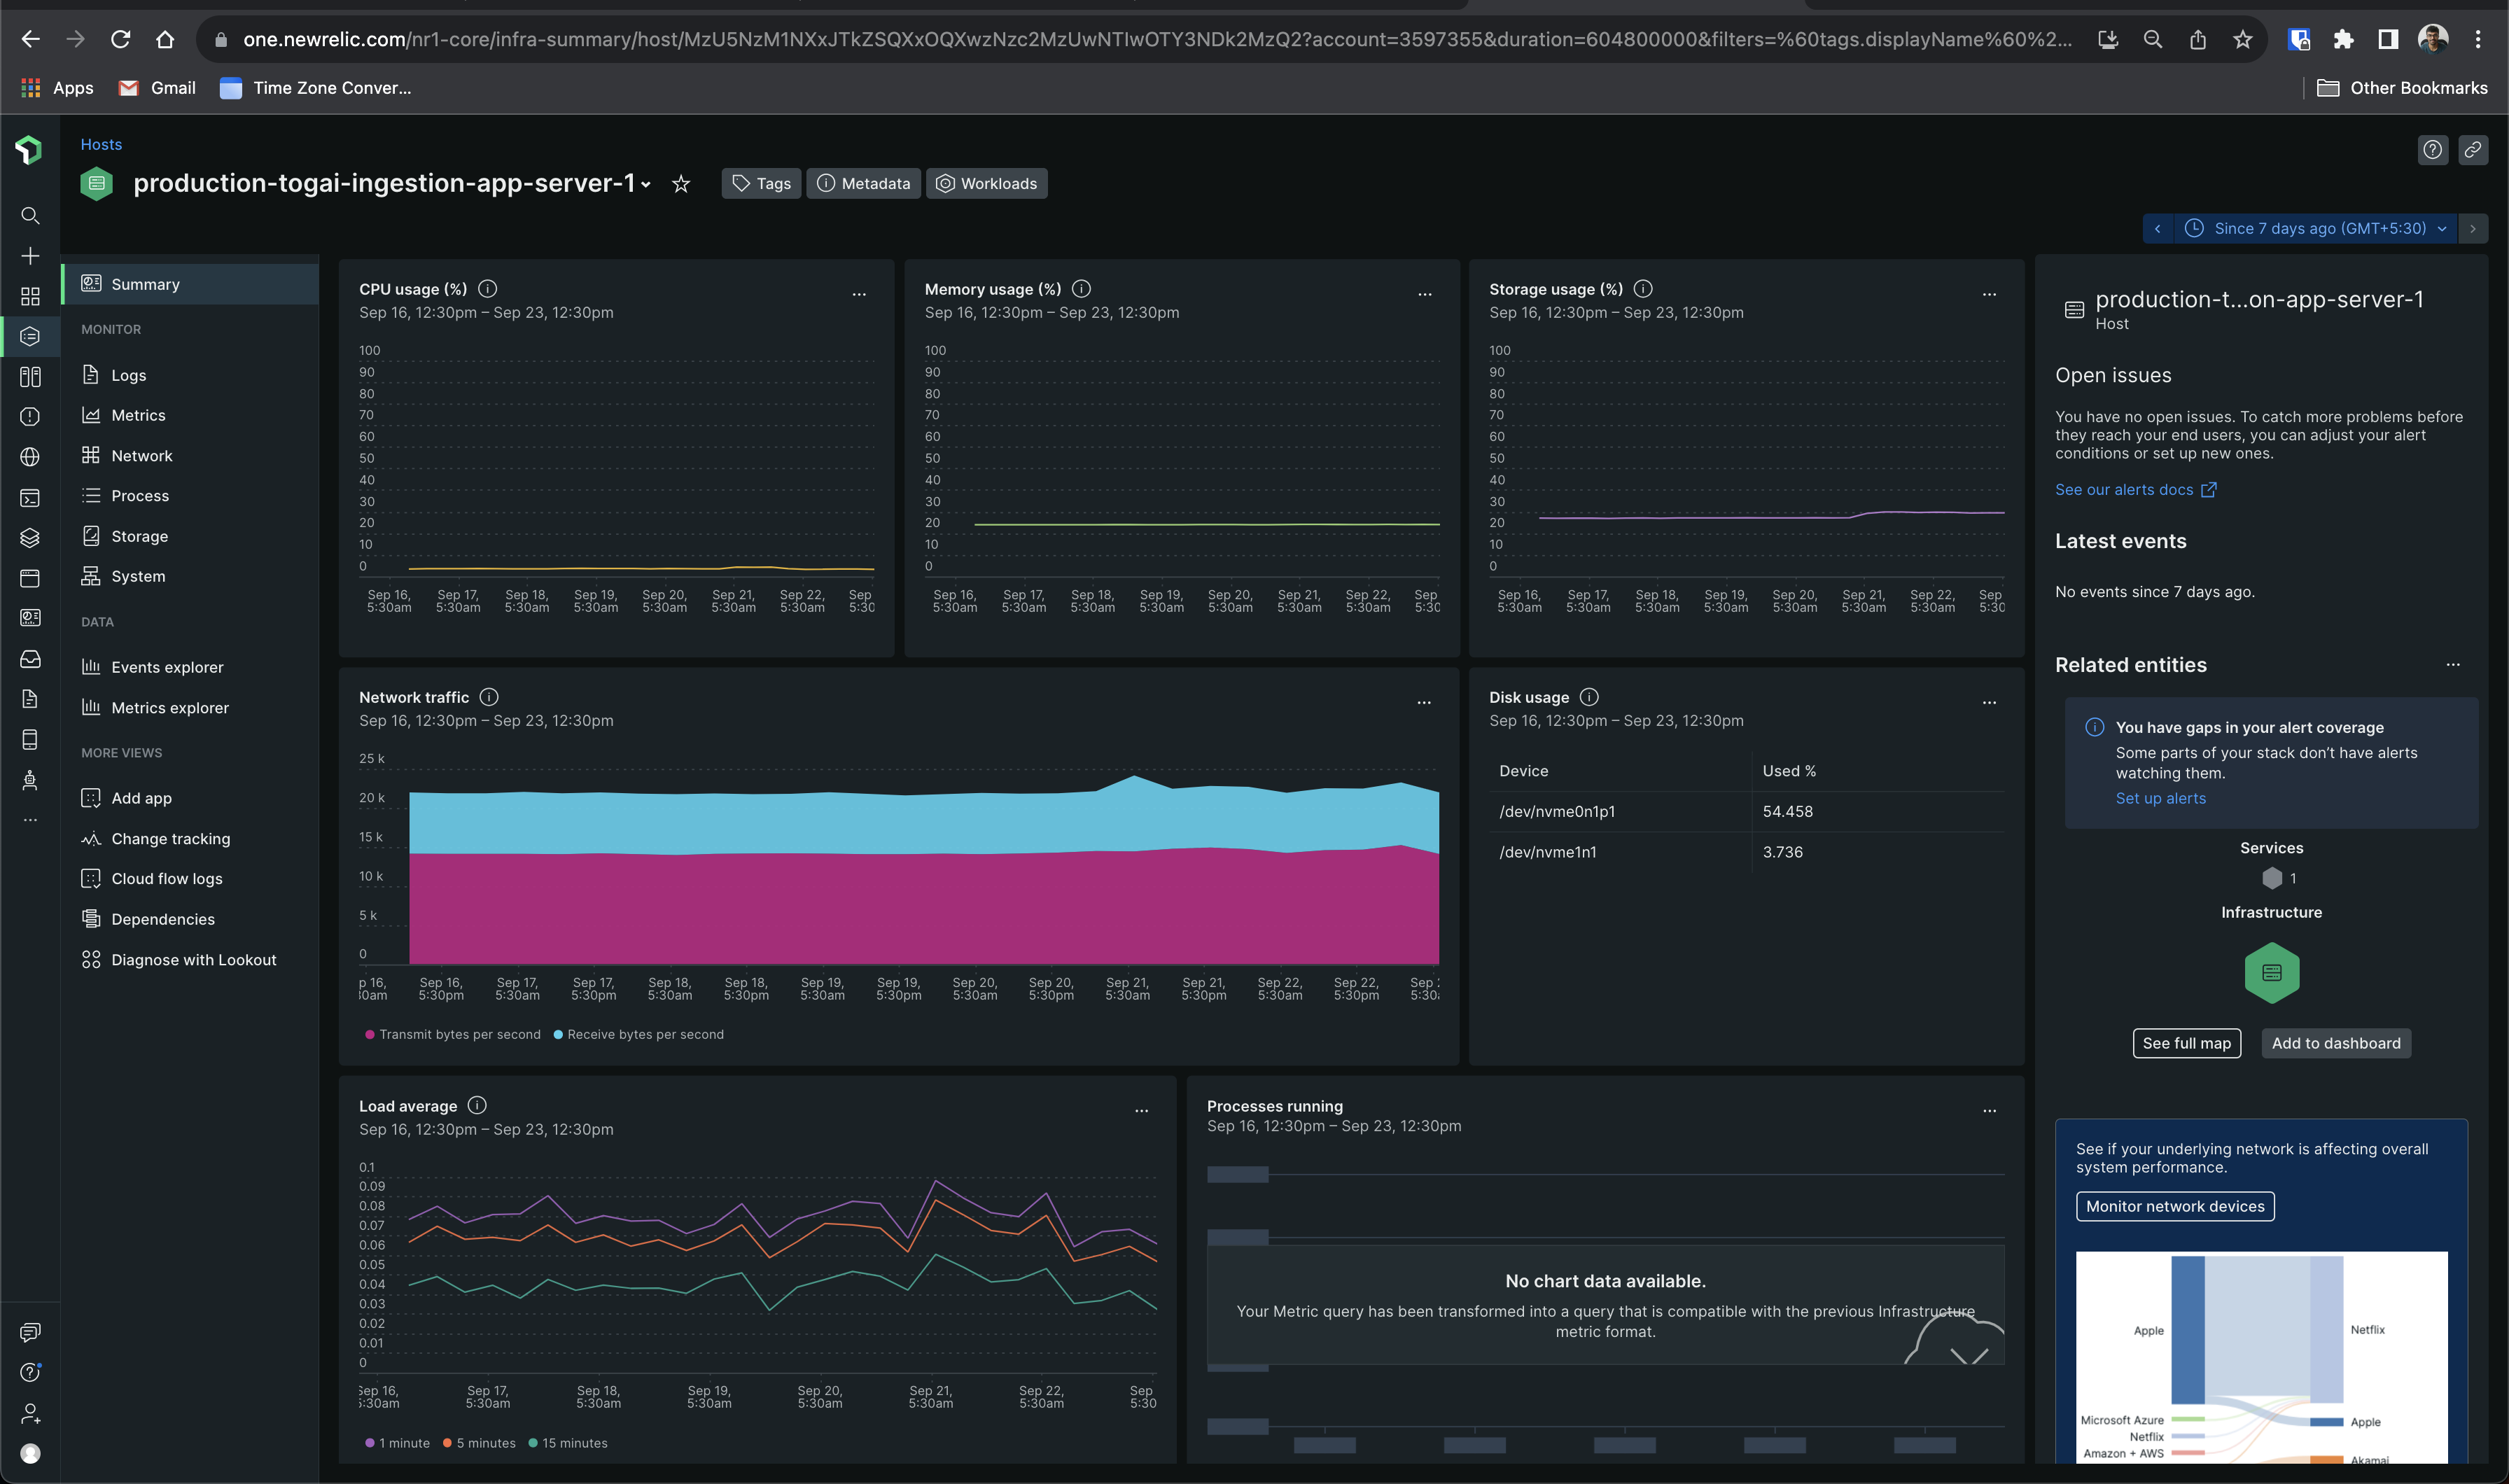
Notice how the CPU and memory usage is flat!
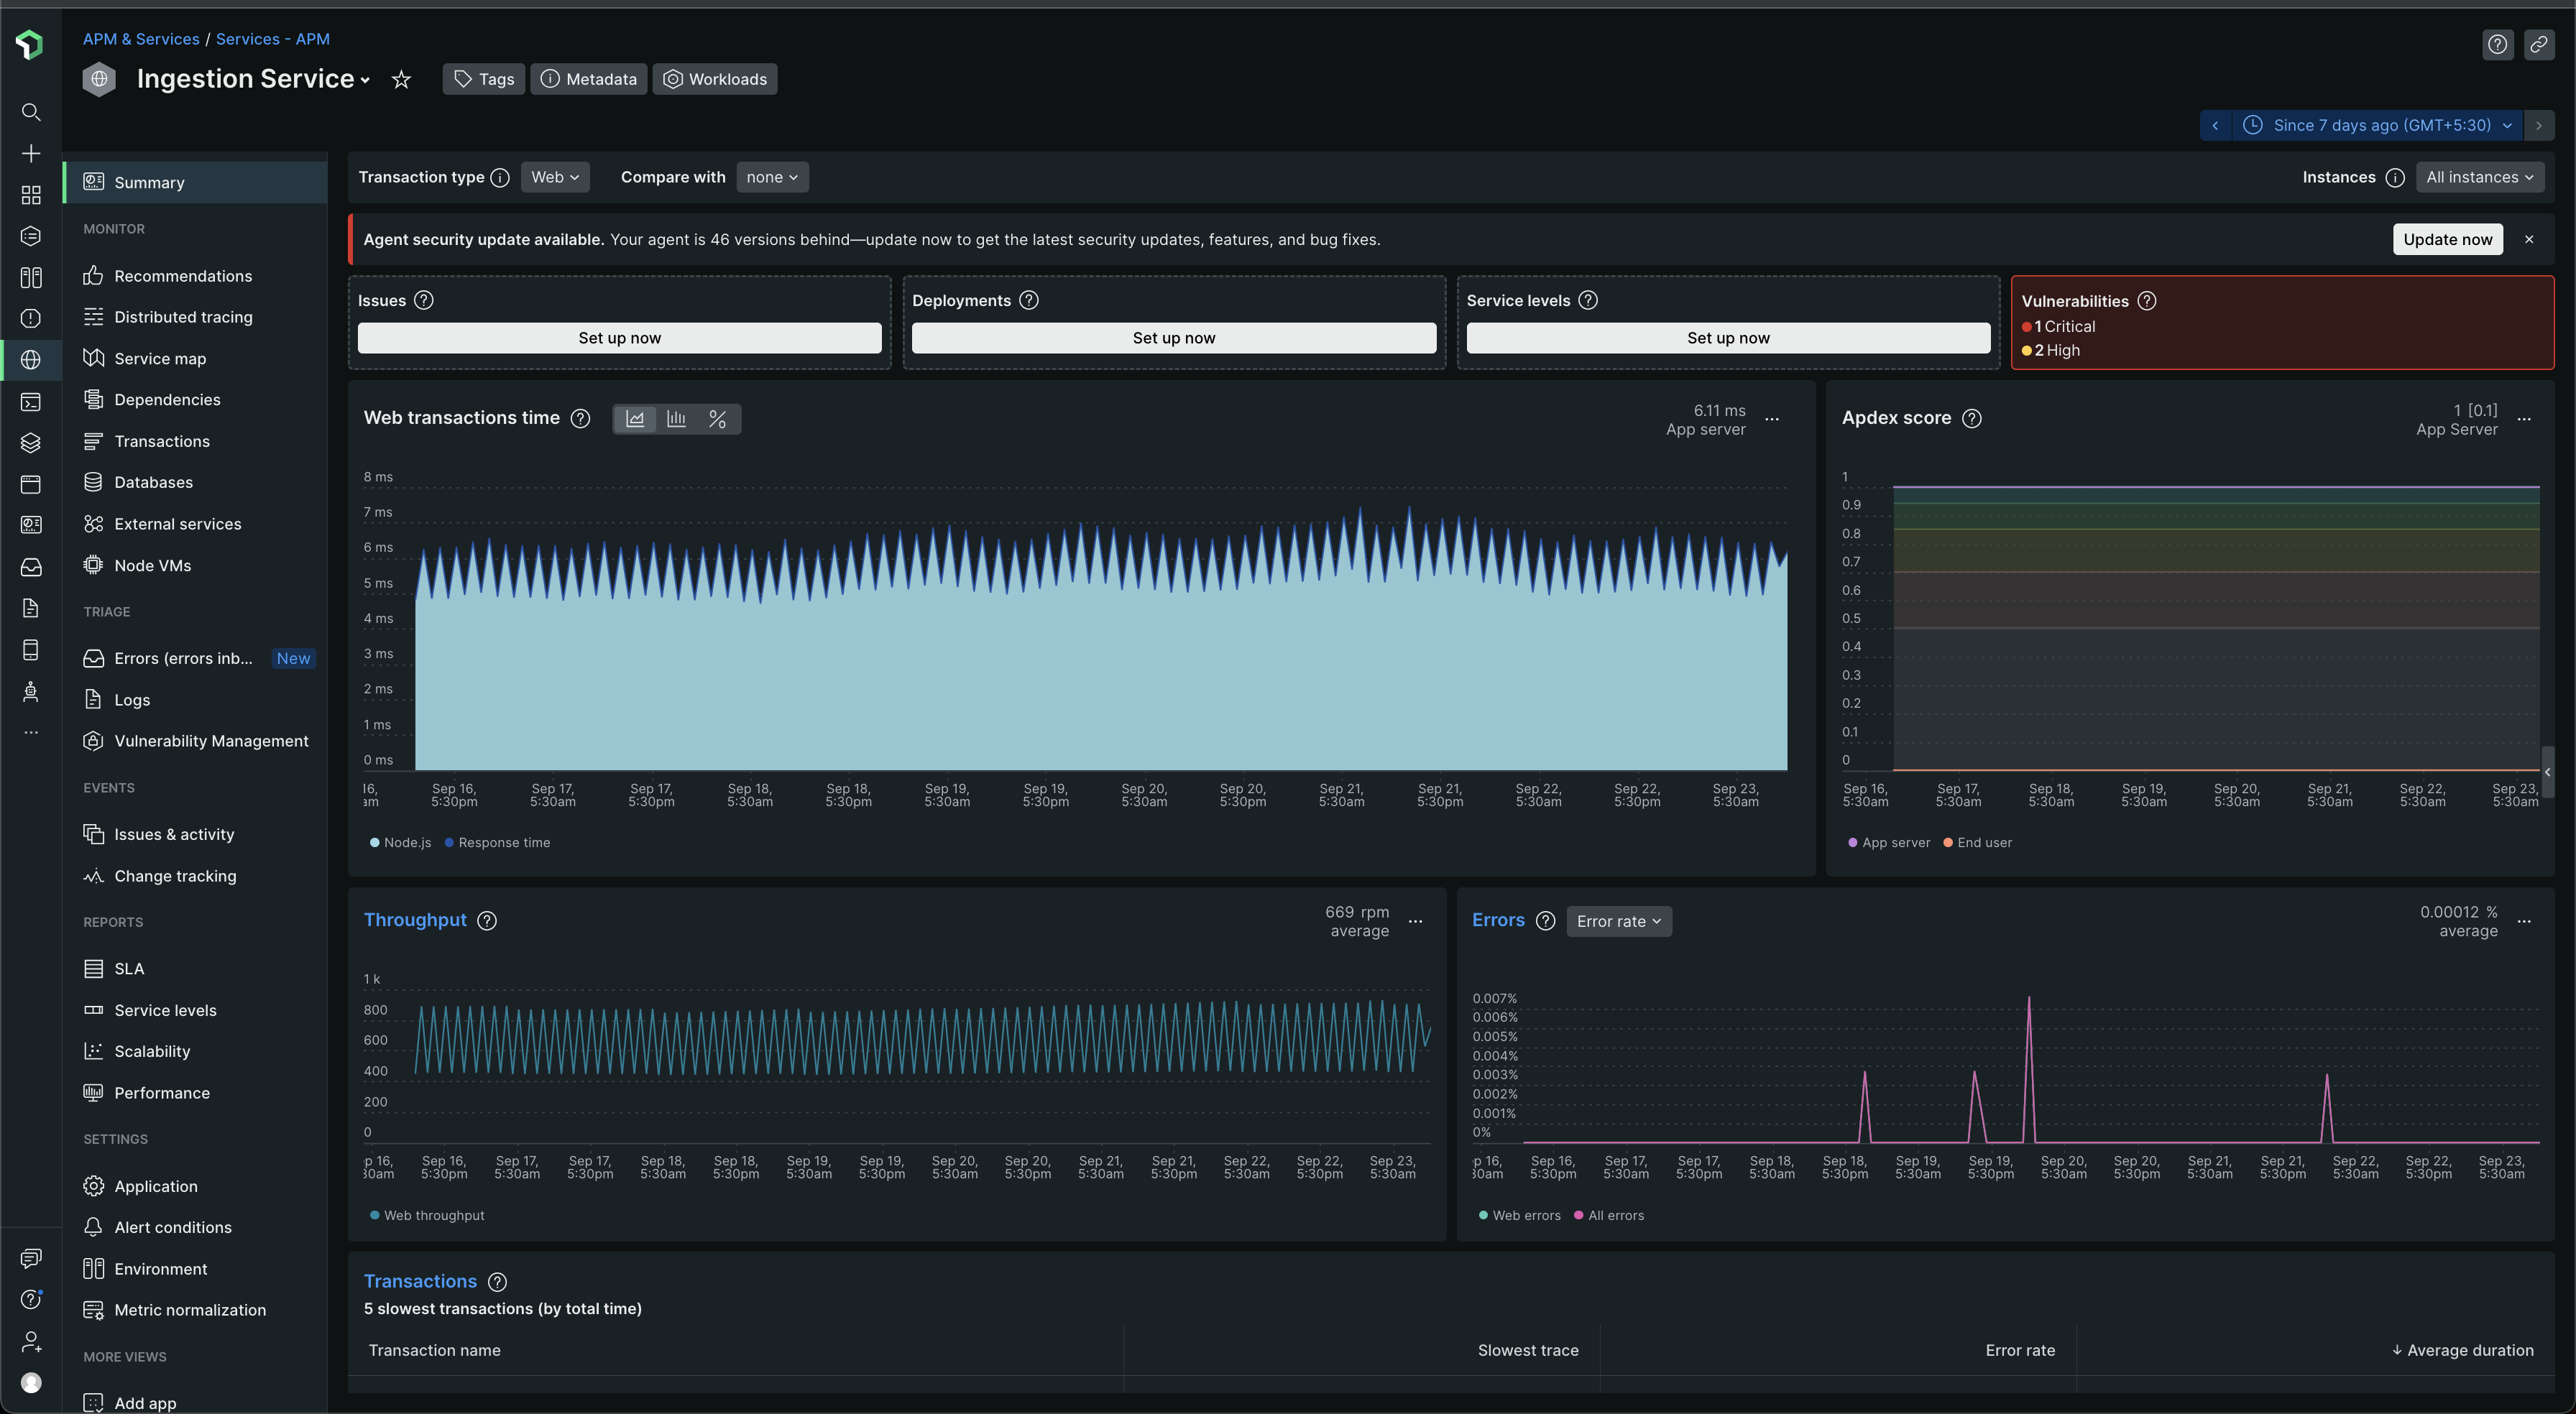
All response times are now within 8 ms 😁


